Forma Visuals · Chart your data
Chart examples
Real answers, each with the request that produced it. Pick the one closest to your work and try it with your own numbers.
For analysts
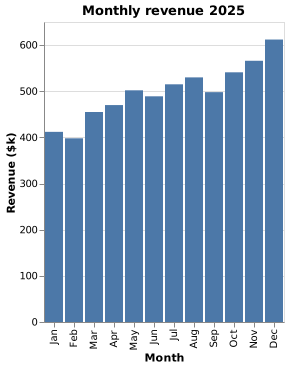
Monthly revenue bar chart
Twelve months of revenue, one bar each, drawn from the figures the request gives. Paste the code into your notebook or dashboard, or open it in the editor.
Vega-Lite
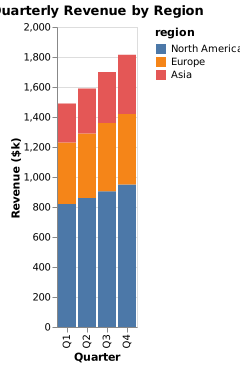
Revenue by region stacked bar chart
Each quarter as one bar, split by region, so the reader sees the total and the mix at once.
Vega-Lite
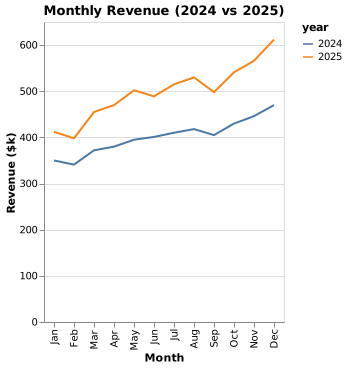
Revenue year over year line chart
This year against last, month by month, so the reader sees where the gap opened. Both years' figures are in the request.
Vega-Lite
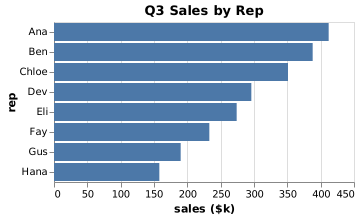
Sales by rep ranked bar chart
A league table as a chart: each rep's quarter, highest first, with names that stay readable on the side.
Vega-Lite
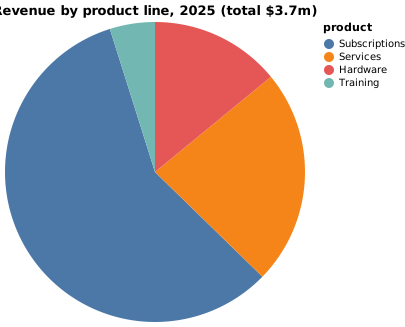
Revenue by product line pie chart
The share each product line brings in, for the one slide where the mix is the point.
Vega-Lite
For developers
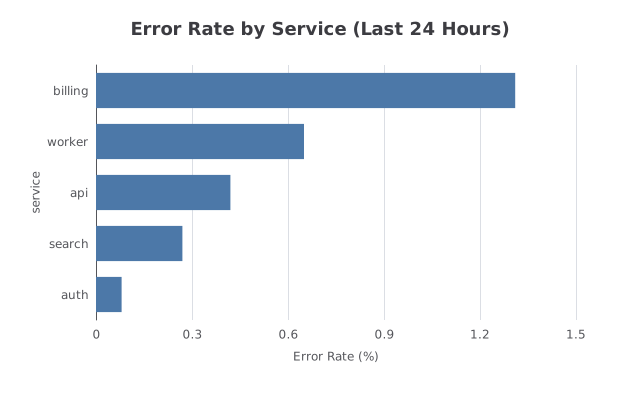
Error rate by service in ECharts
An ECharts option you can pass straight to setOption, for a status page or an internal dashboard, drawn from the rates the request gives.
ECharts
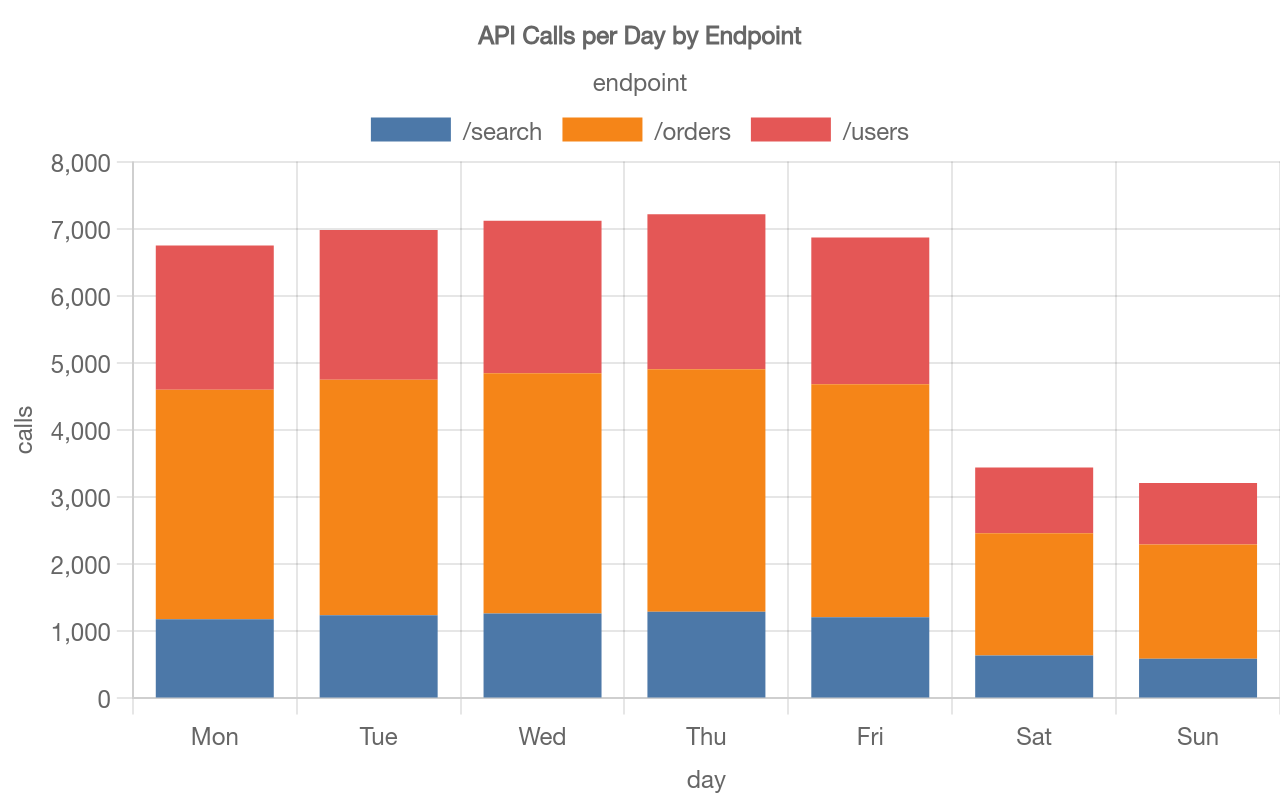
API calls per day by endpoint in Chart.js
One customer's usage as your API returns it, sent as JSON, back as a Chart.js config to show that customer on their usage page.
Chart.js
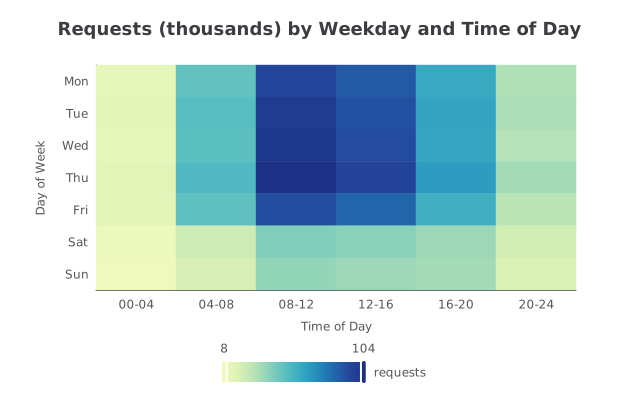
Requests by weekday and time of day: an ECharts heatmap
When your traffic happens, at a glance: the busy weekday middays and the quiet weekend nights, for capacity planning or a status page.
ECharts
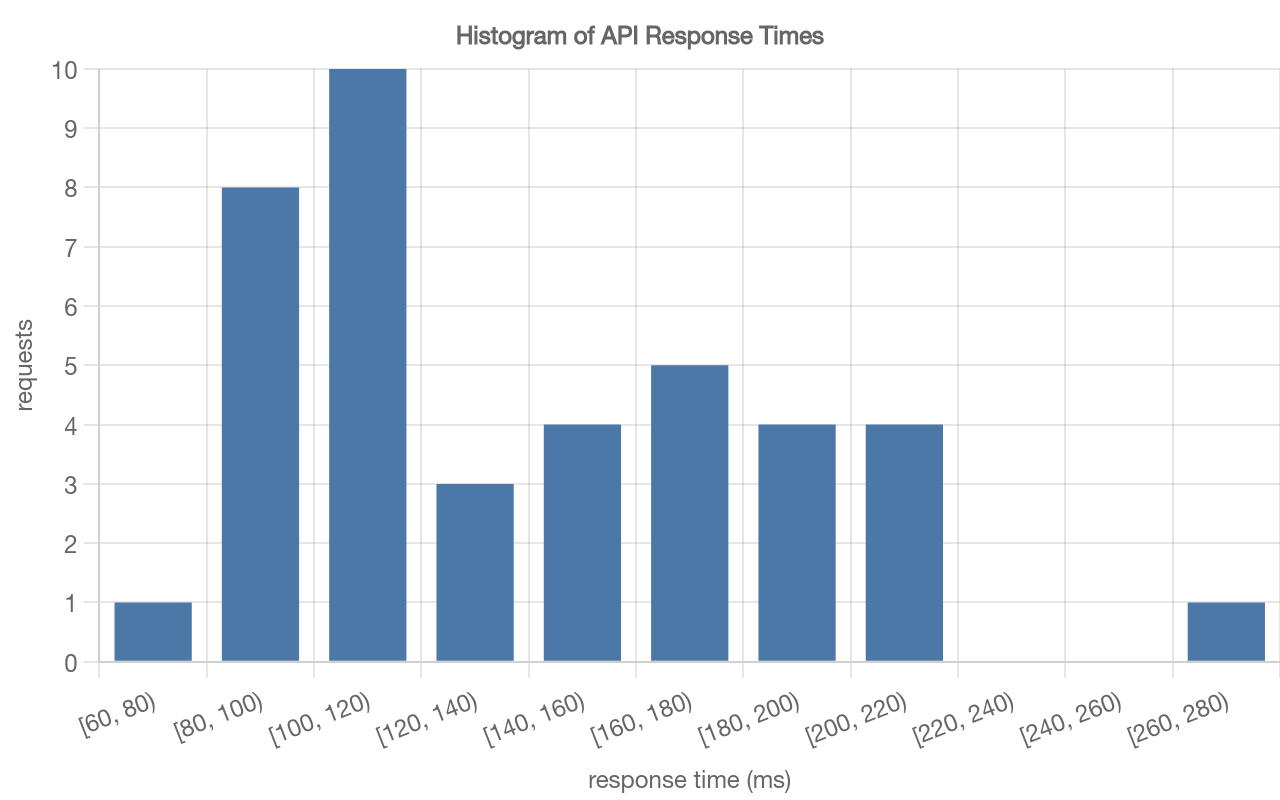
Response time histogram in Chart.js
The shape of your latency, not just its average: how many requests were fast, and how long the slow tail runs.
Chart.js
For students and scientists
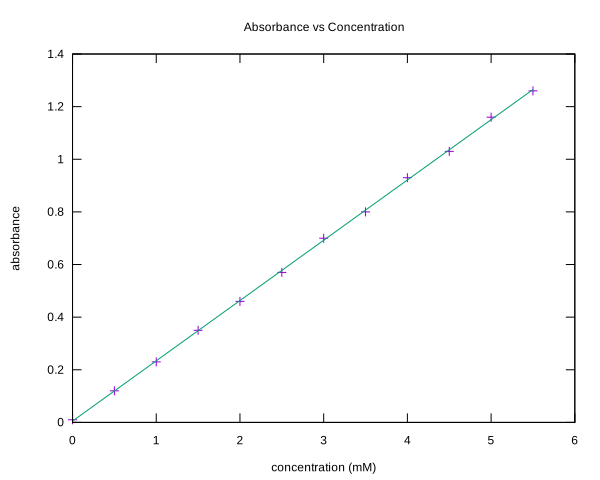
Scatter plot with a line of best fit in gnuplot
Twelve measurements and a straight line for a lab report, as a gnuplot script you can run and edit.
gnuplot
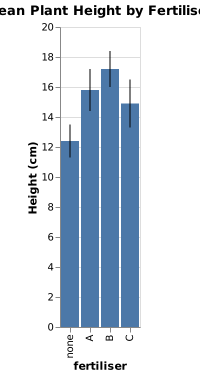
Bar chart with error bars
Group means as bars, with error bars from the low and high values in the request, for a report or a poster.
Vega-Lite
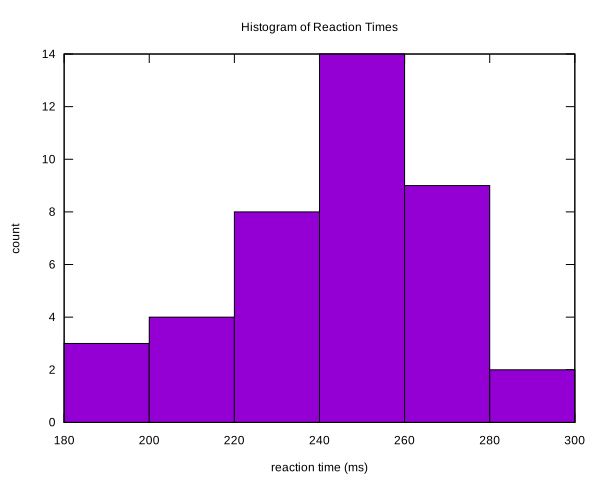
Histogram of measurements in gnuplot
Forty measurements, binned, for the results section of a lab report, as a gnuplot script you can run and edit.
gnuplot
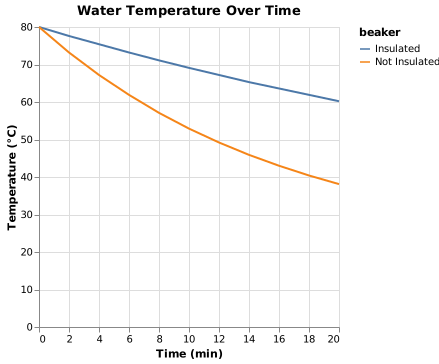
Cooling curve line chart
Two conditions measured over the same times, one line each, for the classic cooling experiment.
Vega-Lite