Why PNG only?
Chart.js draws on a canvas, which is pixels rather than vector shapes, so the editor saves PNG at twice the on-screen size.
Tools · Chart.js
Paste a Chart.js configuration, its type, data and options as JSON, and see it drawn in your browser. Mixed charts, doughnuts and multiple axes work, and the chart downloads as a PNG on a white background.
Or describe it in words and get source you can edit, checked before you see it.
Part of Forma Visuals: Chart your data · For developers
Line chart Monthly active users over a year as a Chart.js line chart on a category axis of months, kept in calendar order: the config exactly as Forma wrote it from the prompt. A real answer from Forma's chart oracle to: “A line chart of monthly active users in 2025, months Jan to Dec in calendar order on x (not alphabetical), users in thousands on y: 12.4, 13.1, 14.8, 15.2, 16.9…”
In your browser, drawn with Plotly.js (MIT), Apache ECharts (Apache-2.0, notice), Chart.js (MIT).
01 Examples
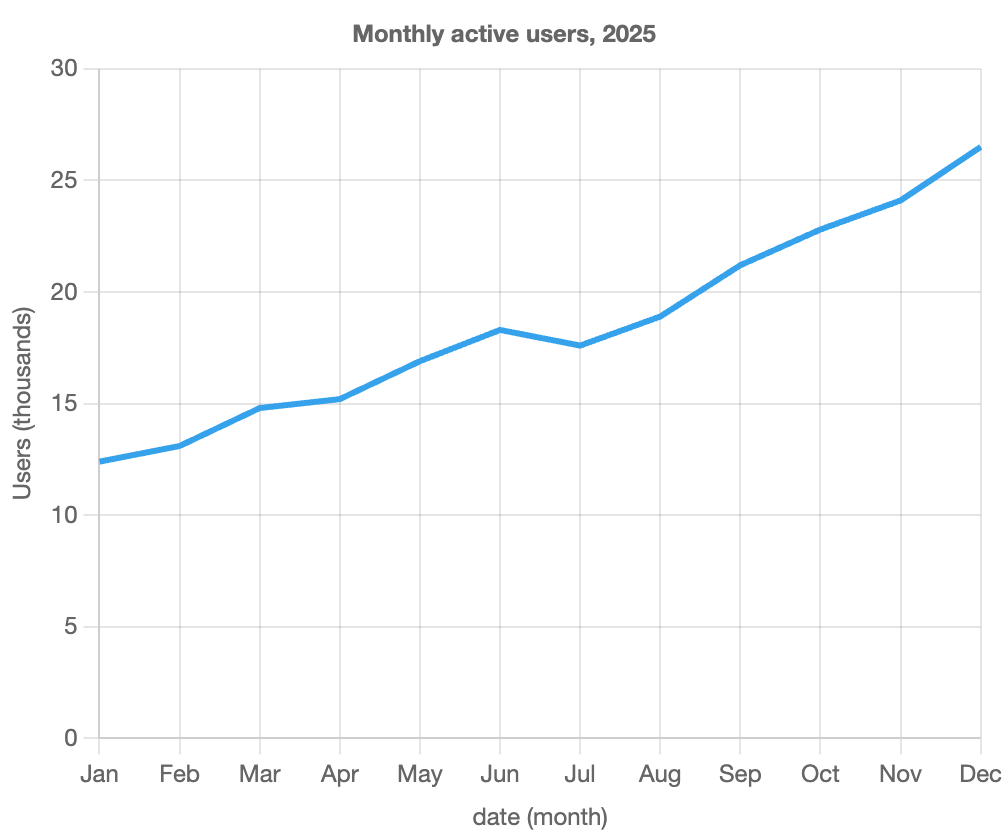
Monthly active users over a year as a Chart.js line chart on a category axis of months, kept in calendar order: the config exactly as Forma wrote it from the prompt.
A real answer from Forma's chart oracle, verified by chart@6baf09f0.
{
  "type": "line",
  "data": {
    "labels": [
      "Jan",
      "Feb",
      "Mar",
      "Apr",
      "May",
      "Jun",
      "Jul",
      "Aug",
      "Sep",
      "Oct",
      "Nov",
      "Dec"
    ],
    "datasets": [
      {
        "type": "line",
        "fill": false,
        "pointRadius": 0,
        "data": [
          12.4,
          13.1,
          14.8,
          15.2,
          16.9,
          18.3,
          17.6,
          18.9,
          21.2,
          22.8,
          24.1,
          26.5
        ]
      }
    ]
  },
  "options": {
    "plugins": {
      "title": {
        "display": true,
        "text": "Monthly active users, 2025"
      },
      "legend": {
        "display": false
      }
    },
    "scales": {
      "x": {
        "type": "category",
        "title": {
          "display": true,
          "text": "date (month)"
        }
      },
      "y": {
        "type": "linear",
        "title": {
          "display": true,
          "text": "Users (thousands)"
        },
        "beginAtZero": true
      }
    }
  }
}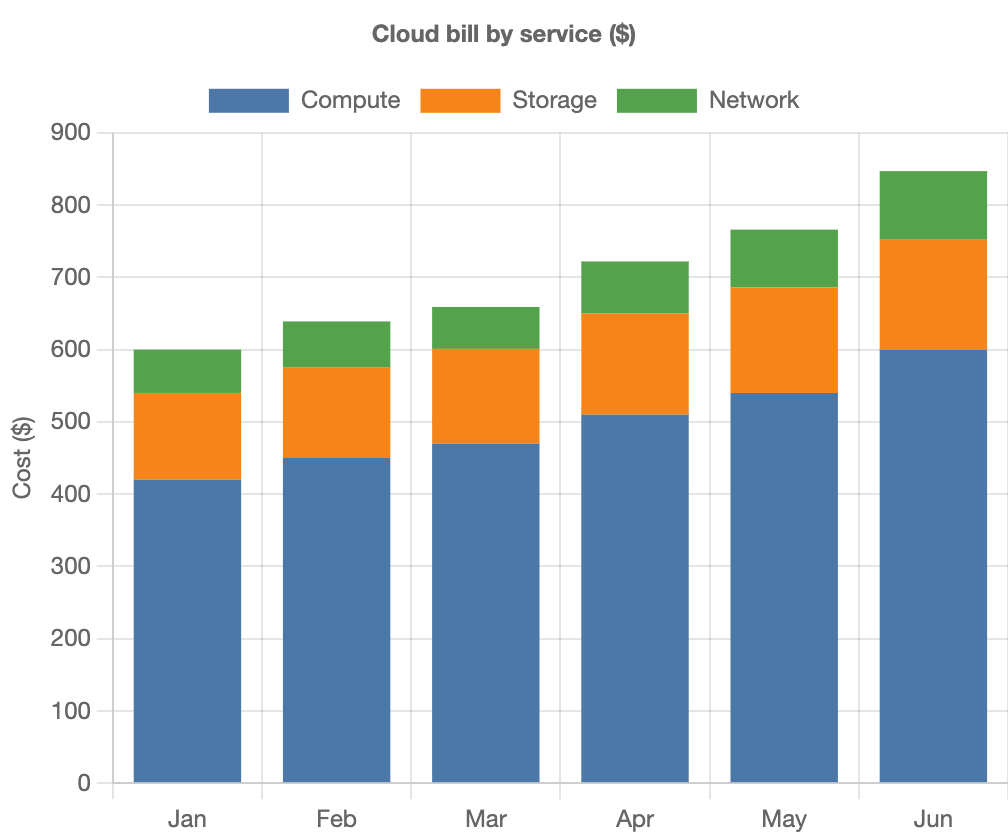
A monthly cloud bill split into compute, storage and network: three Chart.js bar datasets with stacked: true on both the x and y scales. Illustrative data.
{
  "type": "bar",
  "data": {
    "labels": [
      "Jan",
      "Feb",
      "Mar",
      "Apr",
      "May",
      "Jun"
    ],
    "datasets": [
      {
        "label": "Compute",
        "data": [
          420,
          450,
          470,
          510,
          540,
          600
        ],
        "backgroundColor": "#4c78a8"
      },
      {
        "label": "Storage",
        "data": [
          120,
          125,
          131,
          140,
          146,
          152
        ],
        "backgroundColor": "#f58518"
      },
      {
        "label": "Network",
        "data": [
          60,
          64,
          58,
          72,
          80,
          95
        ],
        "backgroundColor": "#54a24b"
      }
    ]
  },
  "options": {
    "plugins": {
      "title": {
        "display": true,
        "text": "Cloud bill by service ($)"
      }
    },
    "scales": {
      "x": {
        "stacked": true
      },
      "y": {
        "stacked": true,
        "title": {
          "display": true,
          "text": "Cost ($)"
        }
      }
    }
  }
}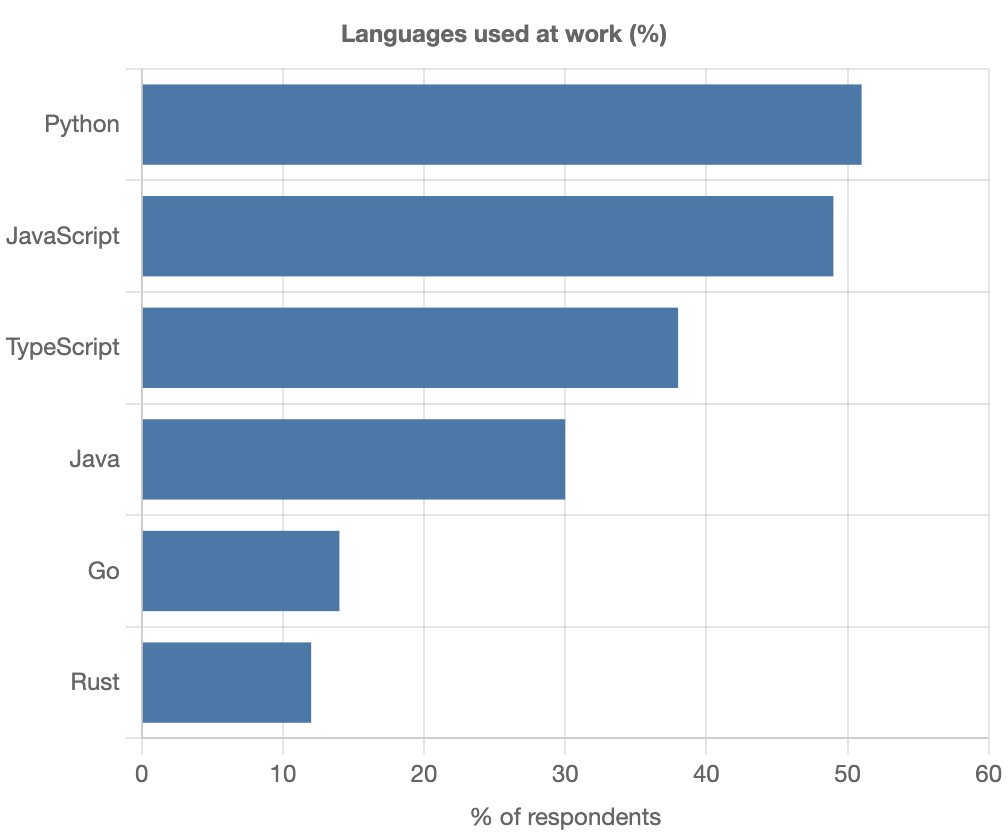
Languages used at work, longest bar first: a Chart.js bar chart turned on its side with indexAxis set to y, and the legend hidden. Illustrative data.
{
  "type": "bar",
  "data": {
    "labels": [
      "Python",
      "JavaScript",
      "TypeScript",
      "Java",
      "Go",
      "Rust"
    ],
    "datasets": [
      {
        "label": "Respondents (%)",
        "data": [
          51,
          49,
          38,
          30,
          14,
          12
        ],
        "backgroundColor": "#4c78a8"
      }
    ]
  },
  "options": {
    "indexAxis": "y",
    "plugins": {
      "title": {
        "display": true,
        "text": "Languages used at work (%)"
      },
      "legend": {
        "display": false
      }
    },
    "scales": {
      "x": {
        "beginAtZero": true,
        "max": 60,
        "title": {
          "display": true,
          "text": "% of respondents"
        }
      }
    }
  }
}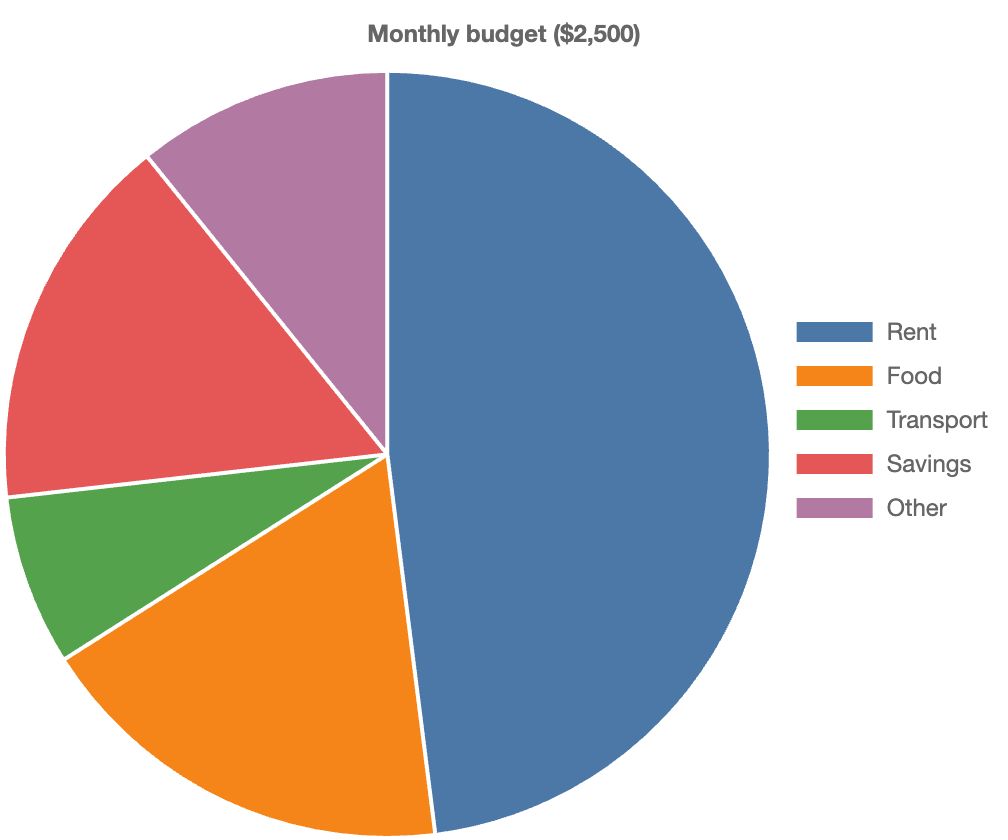
A monthly budget split into five categories as a Chart.js pie chart, one colour per slice and the legend on the right. Illustrative data.
{
  "type": "pie",
  "data": {
    "labels": [
      "Rent",
      "Food",
      "Transport",
      "Savings",
      "Other"
    ],
    "datasets": [
      {
        "data": [
          1200,
          450,
          180,
          400,
          270
        ],
        "backgroundColor": [
          "#4c78a8",
          "#f58518",
          "#54a24b",
          "#e45756",
          "#b279a2"
        ]
      }
    ]
  },
  "options": {
    "plugins": {
      "title": {
        "display": true,
        "text": "Monthly budget ($2,500)"
      },
      "legend": {
        "position": "right"
      }
    }
  }
}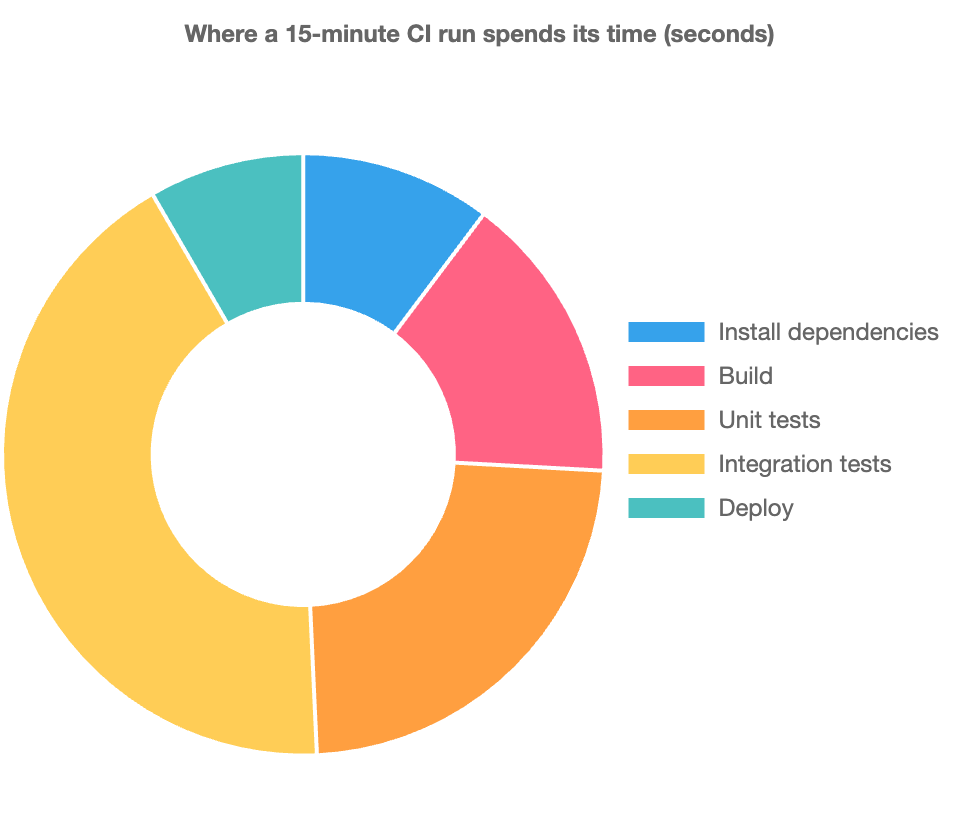
Where a fifteen-minute CI run spends its time, stage by stage, as a Chart.js doughnut with the legend beside it.
{
  "type": "doughnut",
  "data": {
    "labels": [
      "Install dependencies",
      "Build",
      "Unit tests",
      "Integration tests",
      "Deploy"
    ],
    "datasets": [
      {
        "data": [
          92,
          140,
          210,
          380,
          75
        ]
      }
    ]
  },
  "options": {
    "plugins": {
      "title": {
        "display": true,
        "text": "Where a 15-minute CI run spends its time (seconds)"
      },
      "legend": {
        "position": "right"
      }
    }
  }
}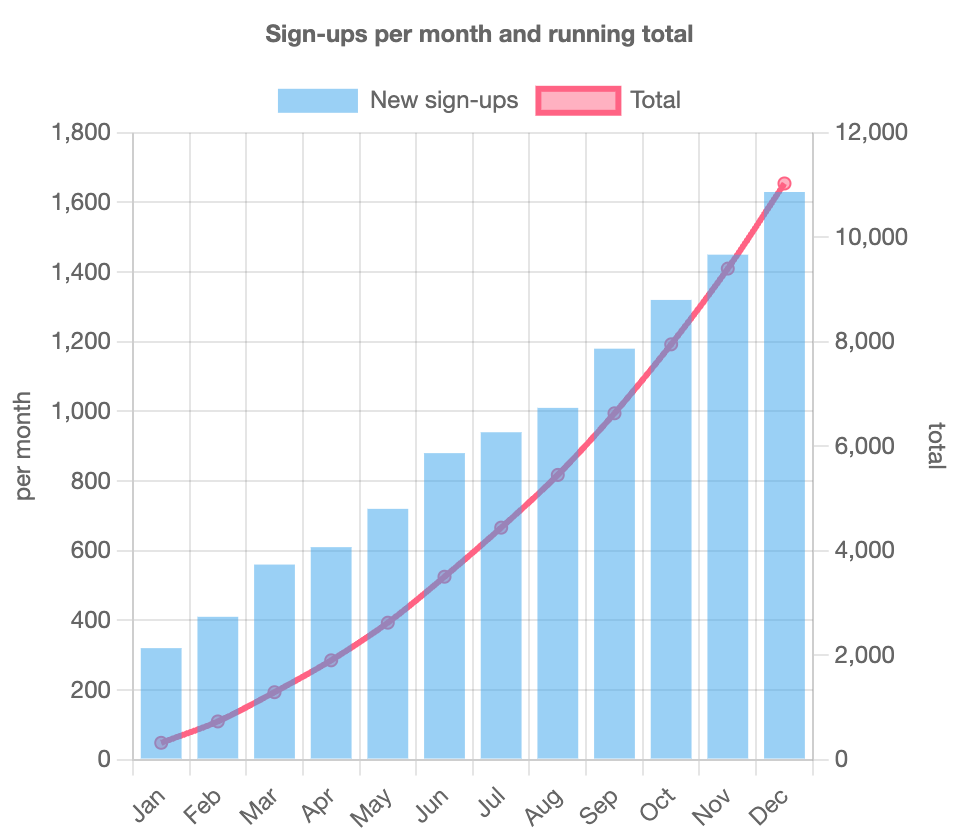
Monthly sign-ups as bars and their running total as a line on a second axis: two Chart.js chart types mixed in one config. Illustrative data.
{
  "type": "bar",
  "data": {
    "labels": [
      "Jan",
      "Feb",
      "Mar",
      "Apr",
      "May",
      "Jun",
      "Jul",
      "Aug",
      "Sep",
      "Oct",
      "Nov",
      "Dec"
    ],
    "datasets": [
      {
        "type": "bar",
        "label": "New sign-ups",
        "data": [
          320,
          410,
          560,
          610,
          720,
          880,
          940,
          1010,
          1180,
          1320,
          1450,
          1630
        ],
        "yAxisID": "y"
      },
      {
        "type": "line",
        "label": "Total",
        "data": [
          320,
          730,
          1290,
          1900,
          2620,
          3500,
          4440,
          5450,
          6630,
          7950,
          9400,
          11030
        ],
        "yAxisID": "y1",
        "tension": 0.3
      }
    ]
  },
  "options": {
    "plugins": {
      "title": {
        "display": true,
        "text": "Sign-ups per month and running total"
      }
    },
    "scales": {
      "y": {
        "position": "left",
        "title": {
          "display": true,
          "text": "per month"
        }
      },
      "y1": {
        "position": "right",
        "grid": {
          "drawOnChartArea": false
        },
        "title": {
          "display": true,
          "text": "total"
        }
      }
    }
  }
}02 About Chart.js
Chart.js is a small JavaScript library that draws charts on a canvas from a single config object. It covers the everyday chart types with a short config and is one of the most widely used charting libraries on the web.
Chart.js draws on a canvas, which is pixels rather than vector shapes, so the editor saves PNG at twice the on-screen size.
No. The config is read as JSON, which cannot hold functions, so tick and tooltip callbacks are left out; options that take plain values work.
No. Chart.js runs in a sandboxed frame on this page with no network access.