Do btex labels work?
Not here. btex … etex runs TeX as a second program, which the sandbox does not allow. Plain string labels such as label("A", z) and defaultfont text work.
Tools · MetaPost
Write a MetaPost figure between beginfig and endfig and get it drawn without a TeX installation. Loops, recursive macros and exact geometry all work; download it as SVG or PNG.
Or describe it in words and get source you can edit, checked before you see it.
Part of Forma Visuals: Draw a technical or research figure · Draw a geometry figure
Koch snowflake A recursive macro replaces every edge with four edges a third as long, four levels deep: a finite area inside an ever longer perimeter.
In your browser, drawn with Plotly.js (MIT), Apache ECharts (Apache-2.0, notice), Chart.js (MIT).
01 Examples
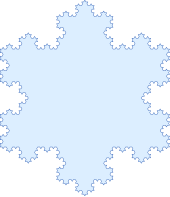
A recursive macro replaces every edge with four edges a third as long, four levels deep: a finite area inside an ever longer perimeter.
% The Koch snowflake: each edge replaced by four edges a third as long,
% four times over. Finite area, but a perimeter that grows without bound.
vardef koch(expr a, b, n) =
  if n = 0: a -- b
  else:
    save p, q, r; pair p, q, r;
    p := a + (b - a) / 3;
    r := a + 2(b - a) / 3;
    q := p + ((r - p) rotated 60);
    koch(a, p, n - 1) & koch(p, q, n - 1) & koch(q, r, n - 1) & koch(r, b, n - 1)
  fi
enddef;
beginfig(1);
  pair A, B, C; A := (0,0); B := (6cm,0); C := A + ((B - A) rotated 60);
  path flake; flake := koch(A, C, 4) & koch(C, B, 4) & koch(B, A, 4) -- cycle;
  fill flake withcolor (0.86,0.93,1);
  draw flake withpen pencircle scaled 0.4pt withcolor (0.15,0.35,0.7);
endfig;
end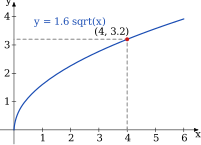
y = 1.6√x on arrowed axes with tick marks and numbers placed by for loops, the curve joined smoothly through sampled points, and one point marked and labelled.
beginfig(1);
  u := 1cm;
  % axes with arrowheads
  drawarrow (-0.5u, 0) -- (6.5u, 0);
  drawarrow (0, -0.5u) -- (0, 4.5u);
  label.bot("x", (6.5u, 0));
  label.lft("y", (0, 4.5u));
  % tick marks and numbers from a loop
  for i = 1 upto 6:
    draw (i*u, -2pt) -- (i*u, 2pt);
    label.bot(decimal i, (i*u, -2pt));
  endfor
  for j = 1 upto 4:
    draw (-2pt, j*u) -- (2pt, j*u);
    label.lft(decimal j, (-2pt, j*u));
  endfor
  % y = sqrt(x) * 1.6, joined smoothly through sampled points
  path p;
  p := (0, 0) for x = 0.25 step 0.25 until 6: .. (x*u, 1.6*sqrt(x)*u) endfor;
  pickup pencircle scaled 1.2pt;
  draw p withcolor (0.1, 0.3, 0.7);
  % mark and label one point on the curve
  z1 = (4u, 3.2u);
  draw (4u, 0) -- z1 -- (0, 3.2u) dashed evenly withcolor 0.6white;
  pickup pencircle scaled 4pt;
  drawdot z1 withcolor (0.8, 0.1, 0.1);
  label.ulft("(4, 3.2)", z1);
  label.rt("y = 1.6 sqrt(x)", (0.6u, 3.8u)) withcolor (0.1, 0.3, 0.7);
endfig;
end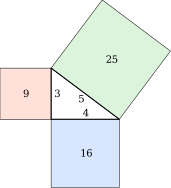
A 3-4-5 right triangle with a square on each side, where 9 plus 16 makes 25, drawn with MetaPost pairs and rotations.
beginfig(1);
  % a right triangle with the square on each side: a*a + b*b = c*c
  u := 6mm;
  pair A, B, C; A := (0,0); B := (4u,0); C := (0,3u);
  pair n; n := (C - B) rotated -90;
  fill A -- B -- B + (0,-4u) -- A + (0,-4u) -- cycle withcolor (0.85,0.9,1);
  fill A -- C -- C + (-3u,0) -- A + (-3u,0) -- cycle withcolor (1,0.88,0.85);
  fill B -- C -- C + n -- B + n -- cycle withcolor (0.86,0.95,0.86);
  draw A -- B -- C -- cycle withpen pencircle scaled 1pt;
  draw A -- B -- B + (0,-4u) -- A + (0,-4u) -- cycle;
  draw A -- C -- C + (-3u,0) -- A + (-3u,0) -- cycle;
  draw B -- C -- C + n -- B + n -- cycle;
  label("16", A + (2u, -2u));
  label("9", A + (-1.5u, 1.5u));
  label("25", 0.5[B, C] + 0.5n);
  label.top("4", 0.5[A, B]);
  label.rt("3", 0.5[A, C]);
  label.llft("5", 0.5[B, C]);
endfig;
end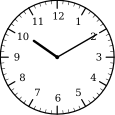
Sixty ticks and twelve numbers placed by a loop using polar directions, with the hands at ten past ten, the time watchmakers like to show.
beginfig(1);
  r := 2cm;
  draw fullcircle scaled 2r withpen pencircle scaled 1.2pt;
  for i = 0 upto 59:
    if i mod 5 = 0:
      draw (dir (90 - 6i)) scaled 0.86r -- (dir (90 - 6i)) scaled r withpen pencircle scaled 1.2pt;
      label(decimal (if i = 0: 12 else: i div 5 fi), (dir (90 - 6i)) scaled 0.72r);
    else:
      draw (dir (90 - 6i)) scaled 0.94r -- (dir (90 - 6i)) scaled r;
    fi
  endfor;
  % ten past ten, the watchmaker's favourite time
  draw origin -- (dir (90 - 305)) scaled 0.5r withpen pencircle scaled 2.4pt;
  draw origin -- (dir (90 - 60)) scaled 0.8r withpen pencircle scaled 1.4pt;
  fill fullcircle scaled 4pt;
endfig;
end02 About MetaPost
MetaPost is John Hobby's language for technical drawings, descended from Knuth's METAFONT. You state equations and paths and it solves for the points, which makes precise geometry, loops of repeated shapes and recursive figures short to write.
Not here. btex … etex runs TeX as a second program, which the sandbox does not allow. Plain string labels such as label("A", z) and defaultfont text work.
At least one beginfig … endfig, and end at the close. The first figure is the one drawn.
No. The renderer runs in a sandbox with no access to files outside its own folder and no network, and nothing you send is kept.