Do formatter functions work?
Only formatter strings, because the option is read as JSON. A JavaScript function cannot be written in JSON, so templates such as "{b}: {c}" are the way to format labels.
Tools · ECharts
Paste an Apache ECharts option as JSON and see it drawn with the SVG renderer. Sankey diagrams, radar charts, lines and bars all work, nothing leaves your browser, and the chart downloads as SVG or PNG.
Or describe it in words and get source you can edit, checked before you see it.
Part of Forma Visuals: Chart your data · For developers
Pie chart Website traffic by device as an ECharts pie series with a legend and item tooltip: the option exactly as Forma wrote it from the prompt. A real answer from Forma's chart oracle to: “A pie chart of website traffic by device, with each slice labelled by name and percentage: Mobile 58%, Desktop 36%, Tablet 6%. Include a legend.”
In your browser, drawn with Plotly.js (MIT), Apache ECharts (Apache-2.0, notice), Chart.js (MIT).
01 Examples
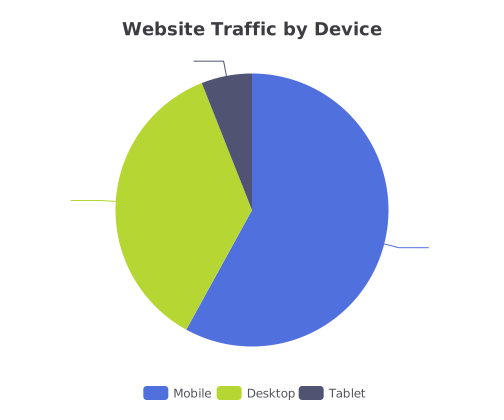
Website traffic by device as an ECharts pie series with a legend and item tooltip: the option exactly as Forma wrote it from the prompt.
A real answer from Forma's chart oracle, verified by chart@6baf09f0.
{
  "title": {
    "text": "Website Traffic by Device",
    "left": "center"
  },
  "tooltip": {
    "trigger": "item"
  },
  "legend": {},
  "series": [
    {
      "type": "pie",
      "radius": "65%",
      "data": [
        {
          "name": "Mobile",
          "value": 58
        },
        {
          "name": "Desktop",
          "value": 36
        },
        {
          "name": "Tablet",
          "value": 6
        }
      ]
    }
  ]
}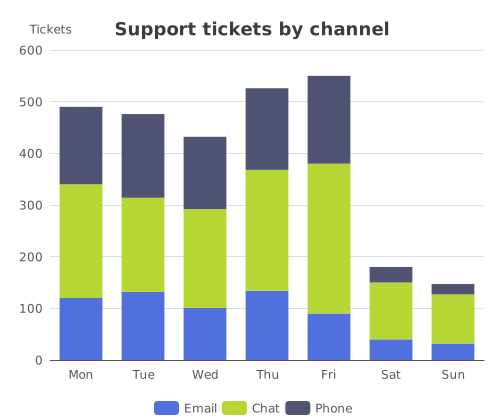
Support tickets per day split by email, chat and phone: three ECharts bar series sharing one stack name, with the legend along the bottom. Illustrative data.
{
  "title": {
    "text": "Support tickets by channel",
    "left": "center"
  },
  "legend": {
    "bottom": 0
  },
  "grid": {
    "left": 50,
    "right": 20,
    "top": 50,
    "bottom": 60
  },
  "xAxis": {
    "type": "category",
    "data": [
      "Mon",
      "Tue",
      "Wed",
      "Thu",
      "Fri",
      "Sat",
      "Sun"
    ]
  },
  "yAxis": {
    "type": "value",
    "name": "Tickets"
  },
  "series": [
    {
      "name": "Email",
      "type": "bar",
      "stack": "total",
      "data": [
        120,
        132,
        101,
        134,
        90,
        40,
        32
      ]
    },
    {
      "name": "Chat",
      "type": "bar",
      "stack": "total",
      "data": [
        220,
        182,
        191,
        234,
        290,
        110,
        95
      ]
    },
    {
      "name": "Phone",
      "type": "bar",
      "stack": "total",
      "data": [
        150,
        162,
        140,
        158,
        170,
        30,
        20
      ]
    }
  ]
}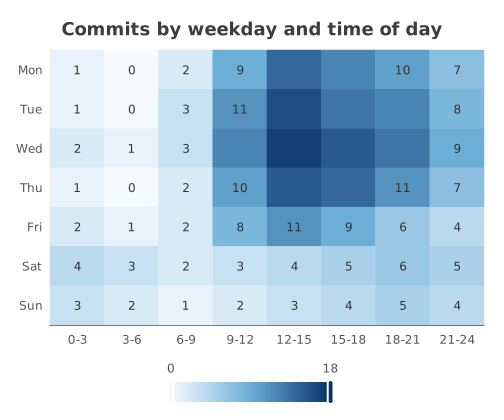
Commits by weekday and three-hour block as an ECharts heatmap on two category axes, coloured by a horizontal visualMap and labelled with each count. Illustrative data.
{
  "title": {
    "text": "Commits by weekday and time of day",
    "left": "center"
  },
  "grid": {
    "left": 50,
    "right": 20,
    "top": 50,
    "bottom": 95
  },
  "xAxis": {
    "type": "category",
    "data": [
      "0-3",
      "3-6",
      "6-9",
      "9-12",
      "12-15",
      "15-18",
      "18-21",
      "21-24"
    ],
    "splitArea": {
      "show": true
    }
  },
  "yAxis": {
    "type": "category",
    "data": [
      "Mon",
      "Tue",
      "Wed",
      "Thu",
      "Fri",
      "Sat",
      "Sun"
    ],
    "inverse": true,
    "splitArea": {
      "show": true
    }
  },
  "visualMap": {
    "min": 0,
    "max": 18,
    "orient": "horizontal",
    "left": "center",
    "bottom": 0,
    "itemHeight": 160,
    "calculable": true,
    "inRange": {
      "color": [
        "#f7fbff",
        "#6baed6",
        "#08306b"
      ]
    }
  },
  "series": [
    {
      "type": "heatmap",
      "label": {
        "show": true
      },
      "data": [
        [
          0,
          0,
          1
        ],
        [
          1,
          0,
          0
        ],
        [
          2,
          0,
          2
        ],
        [
          3,
          0,
          9
        ],
        [
          4,
          0,
          14
        ],
        [
          5,
          0,
          12
        ],
        [
          6,
          0,
          10
        ],
        [
          7,
          0,
          7
        ],
        [
          0,
          1,
          1
        ],
        [
          1,
          1,
          0
        ],
        [
          2,
          1,
          3
        ],
        [
          3,
          1,
          11
        ],
        [
          4,
          1,
          16
        ],
        [
          5,
          1,
          13
        ],
        [
          6,
          1,
          12
        ],
        [
          7,
          1,
          8
        ],
        [
          0,
          2,
          2
        ],
        [
          1,
          2,
          1
        ],
        [
          2,
          2,
          3
        ],
        [
          3,
          2,
          12
        ],
        [
          4,
          2,
          17
        ],
        [
          5,
          2,
          15
        ],
        [
          6,
          2,
          13
        ],
        [
          7,
          2,
          9
        ],
        [
          0,
          3,
          1
        ],
        [
          1,
          3,
          0
        ],
        [
          2,
          3,
          2
        ],
        [
          3,
          3,
          10
        ],
        [
          4,
          3,
          15
        ],
        [
          5,
          3,
          14
        ],
        [
          6,
          3,
          11
        ],
        [
          7,
          3,
          7
        ],
        [
          0,
          4,
          2
        ],
        [
          1,
          4,
          1
        ],
        [
          2,
          4,
          2
        ],
        [
          3,
          4,
          8
        ],
        [
          4,
          4,
          11
        ],
        [
          5,
          4,
          9
        ],
        [
          6,
          4,
          6
        ],
        [
          7,
          4,
          4
        ],
        [
          0,
          5,
          4
        ],
        [
          1,
          5,
          3
        ],
        [
          2,
          5,
          2
        ],
        [
          3,
          5,
          3
        ],
        [
          4,
          5,
          4
        ],
        [
          5,
          5,
          5
        ],
        [
          6,
          5,
          6
        ],
        [
          7,
          5,
          5
        ],
        [
          0,
          6,
          3
        ],
        [
          1,
          6,
          2
        ],
        [
          2,
          6,
          1
        ],
        [
          3,
          6,
          2
        ],
        [
          4,
          6,
          3
        ],
        [
          5,
          6,
          4
        ],
        [
          6,
          6,
          5
        ],
        [
          7,
          6,
          4
        ]
      ]
    }
  ]
}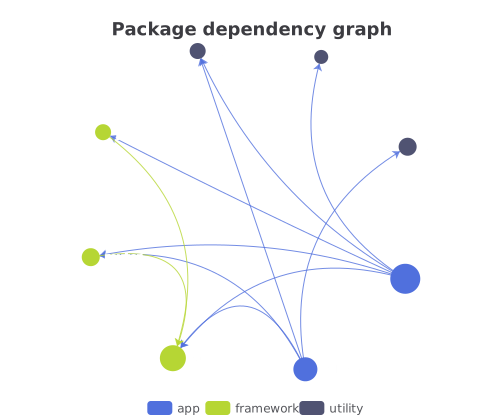
Which packages two apps depend on, as an ECharts graph series in a circular layout: nodes sized and coloured by category, links drawn as curved arrows.
{
  "title": {
    "text": "Package dependency graph",
    "left": "center"
  },
  "legend": {
    "bottom": 0,
    "data": [
      "app",
      "framework",
      "utility"
    ]
  },
  "series": [
    {
      "type": "graph",
      "layout": "circular",
      "circular": {
        "rotateLabel": false
      },
      "roam": false,
      "label": {
        "show": true,
        "position": "right"
      },
      "edgeSymbol": [
        "none",
        "arrow"
      ],
      "edgeSymbolSize": 7,
      "lineStyle": {
        "color": "source",
        "curveness": 0.25,
        "opacity": 0.8
      },
      "categories": [
        {
          "name": "app"
        },
        {
          "name": "framework"
        },
        {
          "name": "utility"
        }
      ],
      "data": [
        {
          "name": "web",
          "category": 0,
          "symbolSize": 30
        },
        {
          "name": "admin",
          "category": 0,
          "symbolSize": 24
        },
        {
          "name": "vue",
          "category": 1,
          "symbolSize": 26
        },
        {
          "name": "router",
          "category": 1,
          "symbolSize": 18
        },
        {
          "name": "pinia",
          "category": 1,
          "symbolSize": 16
        },
        {
          "name": "zod",
          "category": 2,
          "symbolSize": 16
        },
        {
          "name": "date-fns",
          "category": 2,
          "symbolSize": 14
        },
        {
          "name": "lodash",
          "category": 2,
          "symbolSize": 18
        }
      ],
      "links": [
        {
          "source": "web",
          "target": "vue"
        },
        {
          "source": "web",
          "target": "router"
        },
        {
          "source": "web",
          "target": "pinia"
        },
        {
          "source": "web",
          "target": "zod"
        },
        {
          "source": "web",
          "target": "date-fns"
        },
        {
          "source": "admin",
          "target": "vue"
        },
        {
          "source": "admin",
          "target": "router"
        },
        {
          "source": "admin",
          "target": "lodash"
        },
        {
          "source": "admin",
          "target": "zod"
        },
        {
          "source": "router",
          "target": "vue"
        },
        {
          "source": "pinia",
          "target": "vue"
        }
      ]
    }
  ]
}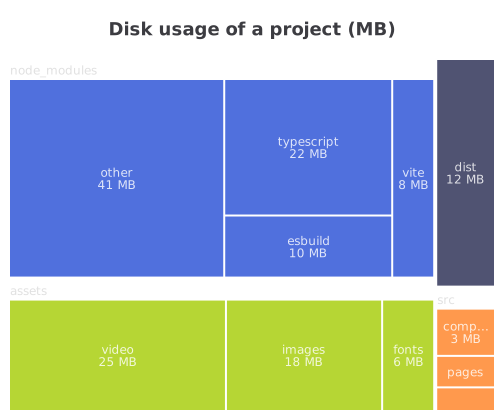
A project's disk usage as an ECharts treemap: folders as labelled groups (upperLabel) and files sized by megabytes inside them. Illustrative data.
{
  "title": {
    "text": "Disk usage of a project (MB)",
    "left": "center"
  },
  "series": [
    {
      "type": "treemap",
      "roam": false,
      "nodeClick": false,
      "breadcrumb": {
        "show": false
      },
      "top": 40,
      "bottom": 10,
      "left": 10,
      "right": 10,
      "label": {
        "show": true,
        "formatter": "{b}\n{c} MB"
      },
      "upperLabel": {
        "show": true,
        "height": 20
      },
      "levels": [
        {
          "itemStyle": {
            "borderWidth": 0,
            "gapWidth": 4
          }
        },
        {
          "itemStyle": {
            "gapWidth": 2
          }
        },
        {
          "colorSaturation": [
            0.35,
            0.6
          ]
        }
      ],
      "data": [
        {
          "name": "node_modules",
          "children": [
            {
              "name": "typescript",
              "value": 22
            },
            {
              "name": "esbuild",
              "value": 10
            },
            {
              "name": "vite",
              "value": 8
            },
            {
              "name": "other",
              "value": 41
            }
          ]
        },
        {
          "name": "assets",
          "children": [
            {
              "name": "images",
              "value": 18
            },
            {
              "name": "fonts",
              "value": 6
            },
            {
              "name": "video",
              "value": 25
            }
          ]
        },
        {
          "name": "src",
          "children": [
            {
              "name": "components",
              "value": 3
            },
            {
              "name": "pages",
              "value": 2
            },
            {
              "name": "lib",
              "value": 1.5
            }
          ]
        },
        {
          "name": "dist",
          "value": 12
        }
      ]
    }
  ]
}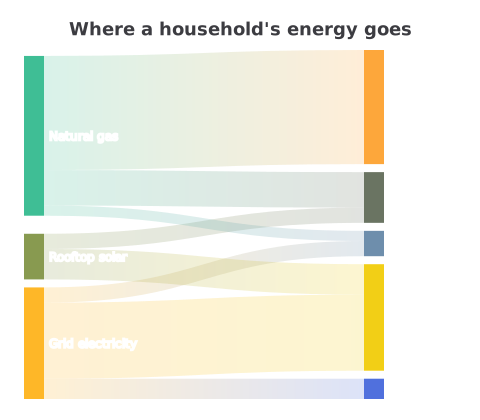
Where a household's energy goes, from grid, solar and gas to heating, hot water, appliances, lighting and cooking, as an ECharts Sankey diagram.
{
  "title": {
    "text": "Where a household's energy goes",
    "left": "center"
  },
  "series": [
    {
      "type": "sankey",
      "top": 50,
      "emphasis": {
        "focus": "adjacency"
      },
      "lineStyle": {
        "color": "gradient",
        "curveness": 0.5
      },
      "data": [
        {
          "name": "Grid electricity"
        },
        {
          "name": "Rooftop solar"
        },
        {
          "name": "Natural gas"
        },
        {
          "name": "Heating"
        },
        {
          "name": "Hot water"
        },
        {
          "name": "Appliances"
        },
        {
          "name": "Lighting"
        },
        {
          "name": "Cooking"
        }
      ],
      "links": [
        {
          "source": "Grid electricity",
          "target": "Appliances",
          "value": 30
        },
        {
          "source": "Grid electricity",
          "target": "Lighting",
          "value": 8
        },
        {
          "source": "Grid electricity",
          "target": "Cooking",
          "value": 6
        },
        {
          "source": "Rooftop solar",
          "target": "Appliances",
          "value": 12
        },
        {
          "source": "Rooftop solar",
          "target": "Hot water",
          "value": 6
        },
        {
          "source": "Natural gas",
          "target": "Heating",
          "value": 45
        },
        {
          "source": "Natural gas",
          "target": "Hot water",
          "value": 14
        },
        {
          "source": "Natural gas",
          "target": "Cooking",
          "value": 4
        }
      ]
    }
  ]
}02 About ECharts
Apache ECharts draws charts from a single option object: series, axes, legend and title. It is known for its range, from Sankey and radar charts to calendars and graphs, and for drawing large data quickly.
Only formatter strings, because the option is read as JSON. A JavaScript function cannot be written in JSON, so templates such as "{b}: {c}" are the way to format labels.
ECharts draws a legend from series names. Give each series a name and add legend: {} to the option.
No. ECharts runs in a sandboxed frame on this page with no network access.