Where you already work
Ask in Claude, ChatGPT, Cursor, VS Code, Windsurf or Codex over MCP, from a script over HTTP, or try a request in the console.
Forma Visuals · Chart your data · For analysts
You have the table and a meeting in an hour. Paste it in and say the chart you need. Over the API and MCP, by default, Forma refuses a chart whose data holds a number you did not give it.
The playground allows illustrative values: any number your request does not give, Forma writes, and the answer says generated. Over the API and MCP, that request is refused unless it sets allow_generated_data.
01 Real answers
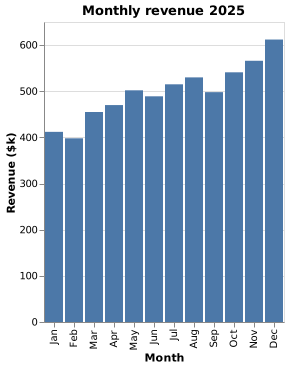
Twelve months of revenue, one bar each, drawn from the figures the request gives. Paste the code into your notebook or dashboard, or open it in the editor.
Vega-Lite
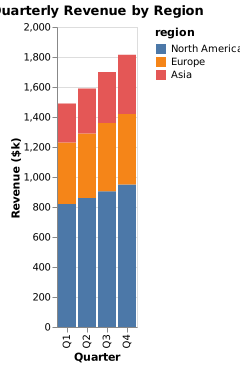
Each quarter as one bar, split by region, so the reader sees the total and the mix at once.
Vega-Lite
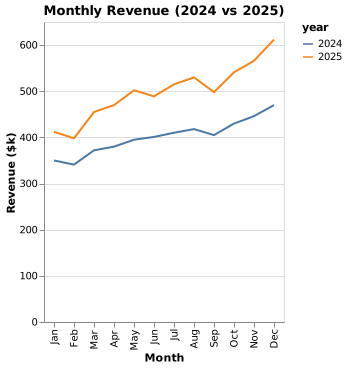
This year against last, month by month, so the reader sees where the gap opened. Both years' figures are in the request.
Vega-Lite
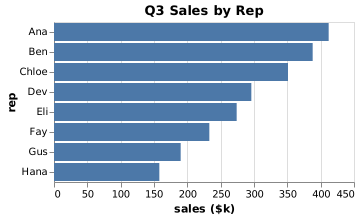
A league table as a chart: each rep's quarter, highest first, with names that stay readable on the side.
Vega-Lite
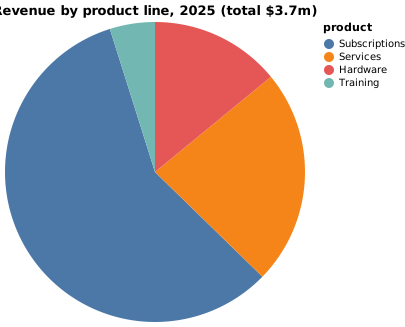
The share each product line brings in, for the one slide where the mix is the point.
Vega-Lite
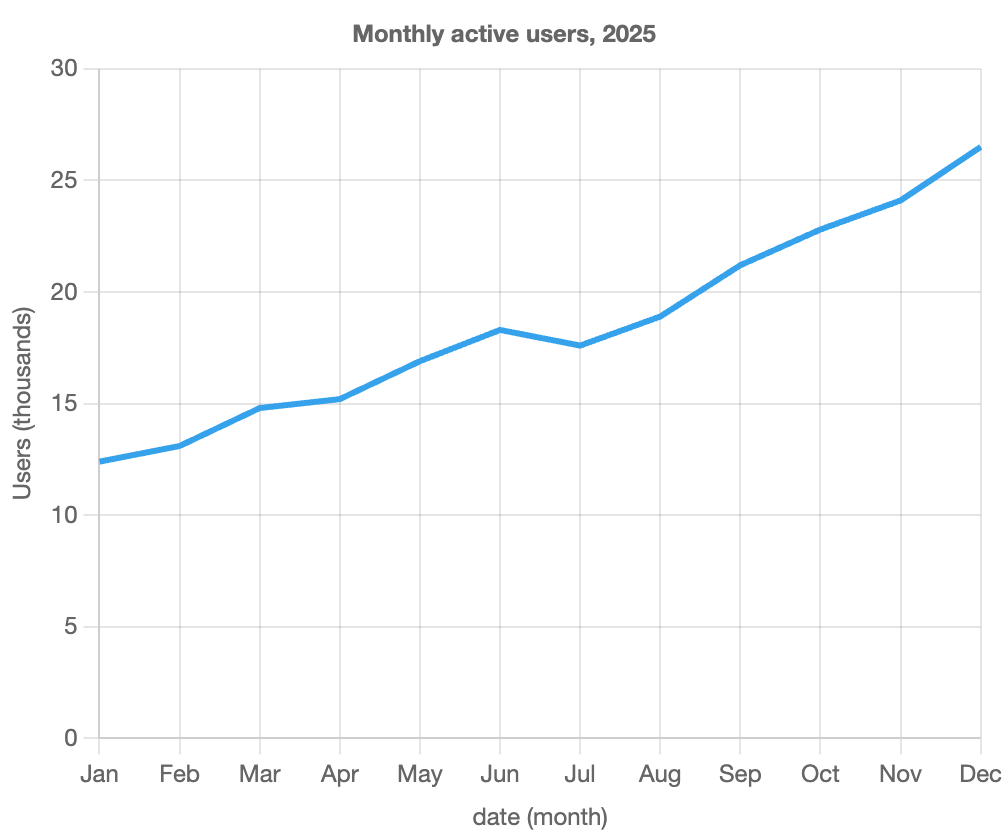
“A line chart of monthly active users in 2025, months Jan to Dec in calendar order on x (not alphabetical), users in thousands on y: 12.4, 13.1, 14.8, 15.2, 16.9, 18.3, 17.6, 18.9, 21.2, 22.8, 24.1, 26.5. Title: Monthly active users, 2025.”
valid · chart@6baf09f0
Try these with their values filled in:
The playground allows illustrative values: any number your request does not give, Forma writes, and the answer says generated. Over the API and MCP, that request is refused unless it sets allow_generated_data.
02 How it fits
Ask in Claude, ChatGPT, Cursor, VS Code, Windsurf or Codex over MCP, from a script over HTTP, or try a request in the console.
Vega-Lite, Plotly, ECharts, Chart.js or gnuplot: say which, and the answer is code you can paste into a notebook, a dashboard or a report.
03 What you still check
04 Questions
Yes. Copy the cells and paste them into the request as text. The whole request, table and words together, can be up to 4,000 characters.
If the request gives no values at all, the API refuses it with DATA_REQUIRED and does not bill it. If it gives some and leaves one out, the chart may come back without that row, which the check does not catch, so check every row is there; if Forma filled the gap in with a number your request does not state, the API refuses it with DATA_REQUIRED and does not bill it.
Over the API and MCP, by default, a chart whose data holds a number your request does not state is refused. The check does not confirm each value sits on the right row, and numbers the chart computes, such as totals, are not compared, so read the chart once before you use it.