Bar chart of monthly revenue for 2025, in thousands of dollars. Title: Monthly revenue 2025. y axis: revenue ($k). Keep the months in calendar order. month,revenue Jan,412 Feb,398 Mar,455 Apr,470 May,502 Jun,489 Jul,515 Aug,530 Sep,498 Oct,541 Nov,566 Dec,612
Forma Visuals · Chart your data · Examples
Monthly revenue bar chart
Twelve months of revenue, one bar each, drawn from the figures the request gives. Paste the code into your notebook or dashboard, or open it in the editor.
For analysts · Vega-Lite
Try it in the consoleOpen the Vega-Lite editor
The playground allows illustrative values: any number your request does not give, Forma writes, and the answer says generated. Over the API and MCP, that request is refused unless it sets allow_generated_data.
01 The chart
Drawn from the code that came back.
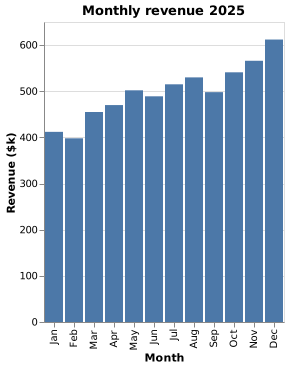
valid · chart@cb3749b2 · 1 credit · 2026-10-07
Sent with the API's default setting, under which a chart is drawn only from values the request gives.
02 The request
In plain words, with its values.
03 What came back
A Vega-Lite spec.
Indented for reading.
{
  "$schema": "https://vega.github.io/schema/vega-lite/v6.json",
  "name": "monthly_revenue",
  "data": {
    "values": [
      {
        "month": "Jan",
        "revenue": 412
      },
      {
        "month": "Feb",
        "revenue": 398
      },
      {
        "month": "Mar",
        "revenue": 455
      },
      {
        "month": "Apr",
        "revenue": 470
      },
      {
        "month": "May",
        "revenue": 502
      },
      {
        "month": "Jun",
        "revenue": 489
      },
      {
        "month": "Jul",
        "revenue": 515
      },
      {
        "month": "Aug",
        "revenue": 530
      },
      {
        "month": "Sep",
        "revenue": 498
      },
      {
        "month": "Oct",
        "revenue": 541
      },
      {
        "month": "Nov",
        "revenue": 566
      },
      {
        "month": "Dec",
        "revenue": 612
      }
    ]
  },
  "title": "Monthly revenue 2025",
  "mark": "bar",
  "encoding": {
    "x": {
      "field": "month",
      "type": "nominal",
      "sort": [
        "Jan",
        "Feb",
        "Mar",
        "Apr",
        "May",
        "Jun",
        "Jul",
        "Aug",
        "Sep",
        "Oct",
        "Nov",
        "Dec"
      ],
      "axis": {
        "title": "Month"
      }
    },
    "y": {
      "field": "revenue",
      "type": "quantitative",
      "axis": {
        "title": "Revenue ($k)"
      }
    }
  }
}
04 When to use it
Where this chart helps.
- One figure across twelve months, where the reader compares month with month.
- Keep the unit in the axis title ($k), so nobody reads 412 as dollars.
- Bars suit separate months; for a running trend over many months, a line reads better.