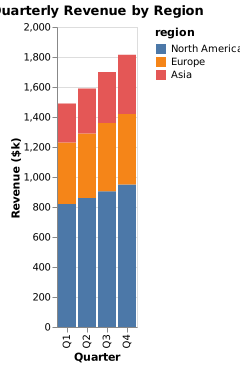
Stacked bar chart of quarterly revenue by region, in thousands of dollars. quarter, North America, Europe, Asia: Q1 820 410 260, Q2 860 430 300, Q3 905 455 340, Q4 950 470 395. x axis: quarter, y axis: revenue ($k).
Forma Visuals · Chart your data · Examples
Revenue by region stacked bar chart
Each quarter as one bar, split by region, so the reader sees the total and the mix at once.
For analysts · Vega-Lite
Try it in the consoleOpen the Vega-Lite editor
The playground allows illustrative values: any number your request does not give, Forma writes, and the answer says generated. Over the API and MCP, that request is refused unless it sets allow_generated_data.
01 The chart
Drawn from the code that came back.
valid · chart@cb3749b2 · 1 credit · 2026-10-07
Sent with the API's default setting, under which a chart is drawn only from values the request gives.
02 The request
In plain words, with its values.
03 What came back
A Vega-Lite spec.
Indented for reading.
{
  "$schema": "https://vega.github.io/schema/vega-lite/v6.json",
  "name": "quarterly_revenue",
  "data": {
    "values": [
      {
        "quarter": "Q1",
        "region": "North America",
        "revenue": 820
      },
      {
        "quarter": "Q1",
        "region": "Europe",
        "revenue": 410
      },
      {
        "quarter": "Q1",
        "region": "Asia",
        "revenue": 260
      },
      {
        "quarter": "Q2",
        "region": "North America",
        "revenue": 860
      },
      {
        "quarter": "Q2",
        "region": "Europe",
        "revenue": 430
      },
      {
        "quarter": "Q2",
        "region": "Asia",
        "revenue": 300
      },
      {
        "quarter": "Q3",
        "region": "North America",
        "revenue": 905
      },
      {
        "quarter": "Q3",
        "region": "Europe",
        "revenue": 455
      },
      {
        "quarter": "Q3",
        "region": "Asia",
        "revenue": 340
      },
      {
        "quarter": "Q4",
        "region": "North America",
        "revenue": 950
      },
      {
        "quarter": "Q4",
        "region": "Europe",
        "revenue": 470
      },
      {
        "quarter": "Q4",
        "region": "Asia",
        "revenue": 395
      }
    ]
  },
  "title": "Quarterly Revenue by Region",
  "mark": "bar",
  "encoding": {
    "x": {
      "field": "quarter",
      "type": "nominal",
      "axis": {
        "title": "Quarter"
      },
      "sort": null
    },
    "y": {
      "field": "revenue",
      "type": "quantitative",
      "axis": {
        "title": "Revenue ($k)"
      }
    },
    "color": {
      "field": "region",
      "type": "nominal",
      "sort": null
    }
  }
}
04 When to use it
Where this chart helps.
- Parts that add up to a whole, over a few periods.
- When the total matters as much as the split.
- To compare one region across quarters, grouped bars read better: a stacked segment is hard to compare unless it sits on the axis.