Drawn by Forma
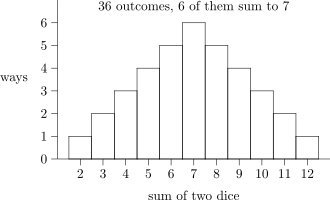
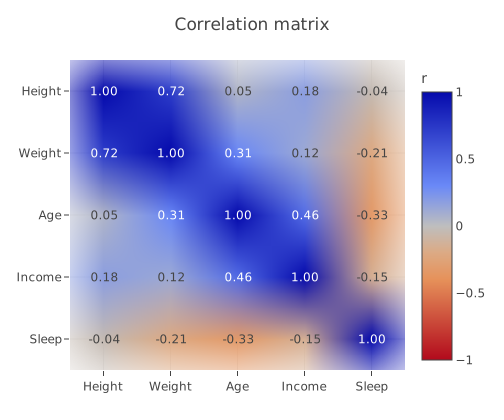
Vega-Lite, gnuplot, TikZ, MetaPost and PiCTeX.
Sent to Forma's sandbox renderer and drawn by the same engines that draw Forma's own answers, each in a locked-down process with no network. Nothing you send is kept.
Tools
Paste the source of a chart or a figure in any language Forma answers in, see it drawn, and download it as SVG or PNG. Free, with no sign-up.
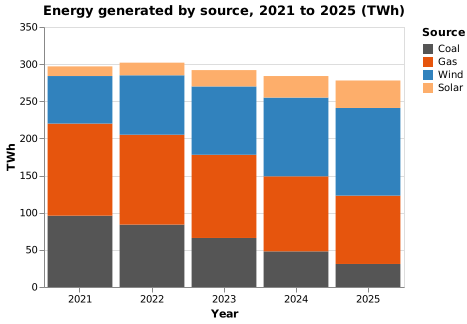
Stacked bar chart Electricity generated by coal, gas, wind and solar over five years, stacked in a fixed order with a calculate transform and the order channel, so wind overtaking gas is plain to see.
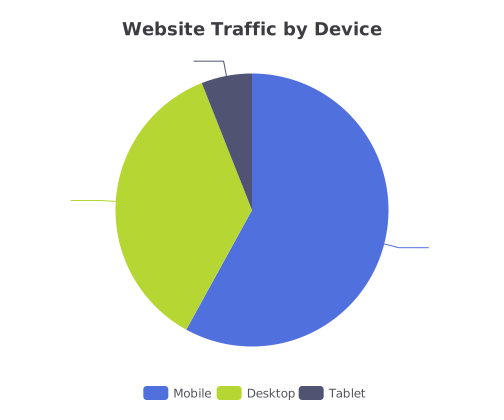
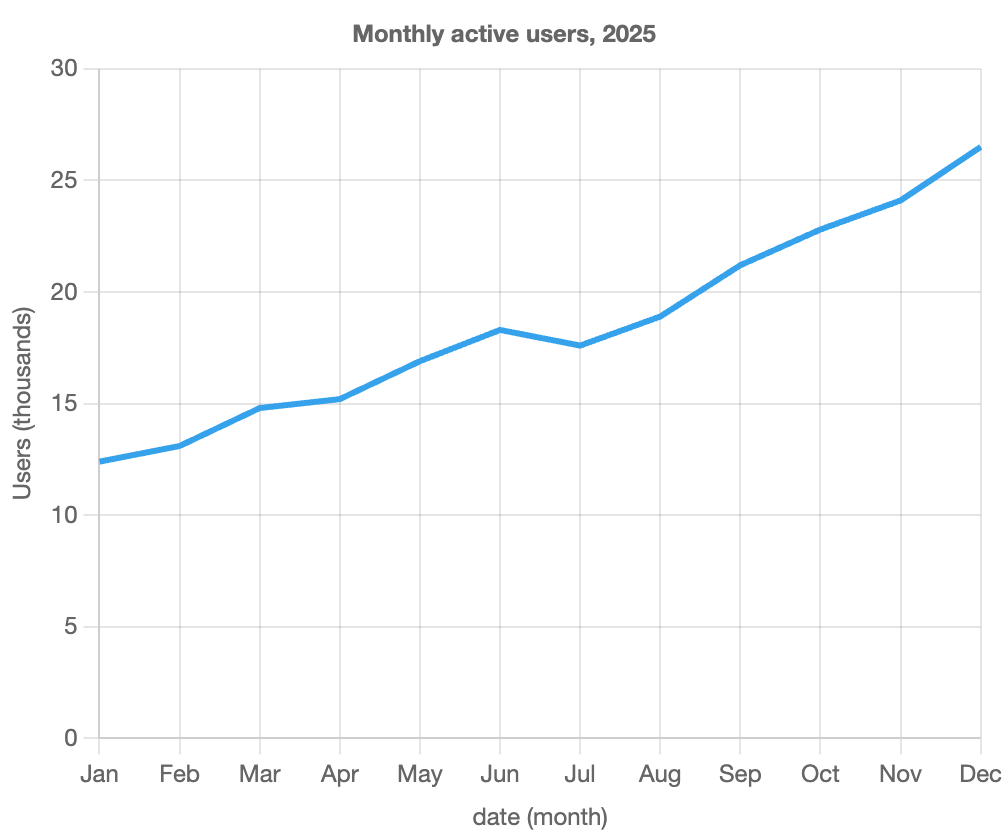
In your browser, drawn with Plotly.js (MIT), Apache ECharts (Apache-2.0, notice), Chart.js (MIT).
Drawn by Forma
Sent to Forma's sandbox renderer and drawn by the same engines that draw Forma's own answers, each in a locked-down process with no network. Nothing you send is kept.
Drawn in your browser
These are JavaScript libraries, so they run in a sandboxed frame on this page, cut off from the page and from storage, loading only this site's own files. What you paste in them is not sent anywhere.
Have Forma write it
Every format here is one Forma answers in. Describe the chart or figure and Forma returns the source, checked against its rules, from the Forma console or your agent.