Do I paste a whole document?
No. Paste the picture from \beginpicture to \endpicture; the renderer supplies the document and loads PiCTeX.
Tools · PiCTeX
Paste a PiCTeX picture, from \beginpicture to \endpicture, and get it typeset by TeX. Axes, plots, histograms and labelled points work; download the result as SVG or PNG.
Or describe it in words and get source you can edit, checked before you see it.
Part of Forma Visuals: Draw a technical or research figure · Draw a geometry figure
Histogram: sums of two dice How many of the 36 ways to roll two dice give each total, as a PiCTeX histogram. Seven comes up most often, six ways out of 36.
In your browser, drawn with Plotly.js (MIT), Apache ECharts (Apache-2.0, notice), Chart.js (MIT).
01 Examples
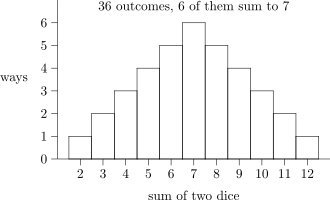
How many of the 36 ways to roll two dice give each total, as a PiCTeX histogram. Seven comes up most often, six ways out of 36.
\beginpicture
\setcoordinatesystem units <6mm,6mm>
\setplotarea x from 1 to 13, y from 0 to 7
\axis bottom label {sum of two dice} ticks withvalues 2 3 4 5 6 7 8 9 10 11 12 / at 2 3 4 5 6 7 8 9 10 11 12 / /
\axis left label {ways} ticks numbered from 0 to 6 by 1 /
\sethistograms
\plot 1.5 0  2.5 1  3.5 2  4.5 3  5.5 4  6.5 5  7.5 6  8.5 5  9.5 4  10.5 3  11.5 2  12.5 1 /
\put {36 outcomes, 6 of them sum to 7} at 7 6.7
\endpicture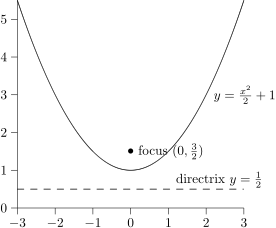
y = x²/2 + 1 with its focus and directrix marked: every point on the curve is as far from the focus as from the dashed line.
\beginpicture
\setcoordinatesystem units <1cm,1cm>
\setplotarea x from -3 to 3, y from 0 to 5.5
\axis bottom ticks numbered from -3 to 3 by 1 /
\axis left ticks numbered from 0 to 5 by 1 /
\setquadratic
\plot -3 5.5  -2 3  -1 1.5  0 1  1 1.5  2 3  3 5.5 /
\setlinear
\setdashes
\plot -3 0.5  3 0.5 /
\setsolid
\put {$\bullet$} at 0 1.5
\put {focus $(0,\frac{3}{2})$} [l] <2mm,0mm> at 0 1.5
\put {directrix $y=\frac{1}{2}$} [l] <0mm,2.5mm> at 1.2 0.5
\put {$y=\frac{x^2}{2}+1$} [l] <2mm,0mm> at 2 3
\endpicture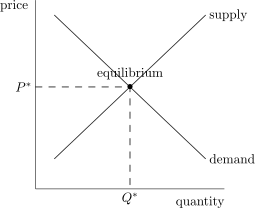
Two straight lines and the point where they cross: the market's equilibrium price P* and quantity Q*, with dashed guides to each axis.
\beginpicture
\setcoordinatesystem units <1cm,1cm>
\setplotarea x from 0 to 5, y from 0 to 5
\axis bottom /
\put {quantity} [rt] <0mm,-2mm> at 5 0
\axis left /
\put {price} [rt] <-2mm,0mm> at 0 5
\plot 0.5 0.8  4.5 4.6 /
\plot 0.5 4.6  4.5 0.8 /
\put {supply} [l] <1mm,0mm> at 4.5 4.6
\put {demand} [l] <1mm,0mm> at 4.5 0.8
\setdashes
\plot 0 2.7  2.5 2.7  2.5 0 /
\setsolid
\put {$\bullet$} at 2.5 2.7
\put {equilibrium} [b] <0mm,2mm> at 2.5 2.7
\put {$P^*$} [r] <-1mm,0mm> at 0 2.7
\put {$Q^*$} [t] <0mm,-1mm> at 2.5 0
\endpicture02 About PiCTeX
PiCTeX is one of the oldest TeX drawing packages, built from plain TeX macros: you set a coordinate system and plot area, then draw axes, curves and labels. It is still found in older papers and class notes, and it is compact for plots with labelled axes.
No. Paste the picture from \beginpicture to \endpicture; the renderer supplies the document and loads PiCTeX.
Use \setquadratic before \plot for a curve through your points, as in the parabola example, and \setlinear to go back to straight segments.
No. Pictures are typeset in a sandbox with no network and no access to files outside their own folder, and nothing is stored.