Products
Charts, figures and coverage policies, from plain language.
Three products, each an oracle: you describe what you want, in words, and it returns code in the format you pick that has passed its rules. An oracle is what you call and what you pay for, and every plan can call every oracle.
01 Charts
chart
Describe a chart in plain language and get back a chart specification that has been checked against versioned rules before you see it.
| Format | Returns | Refuses rather than approximate |
|---|---|---|
| vega-litedefault | A Vega-Lite spec | Expresses the most |
| plotly | A Plotly figure | Trails, maps, images |
| echarts | An ECharts option | As plotly, axis format strings, and ranges between two dates |
| chartjs | A Chart.js config | As echarts, and box plots, heatmaps, text labels, colour scales, lines across the plot, layers beside a legend, small multiples |
| gnuplot | A gnuplot script | Time axes, data at an address, transforms before plotting |
chart@6baf09f0“A candlestick chart of a stock over 20 trading days: a thin rule from low to high and a bar from open to close for each day, green when close is above open and red when below. The price axis must not start at zero; scale it to the price range (about 95 to 125) so the candles are tall and readable.”
chart@6baf09f0“A heatmap of server request latency: day of week on y in calendar order Mon, Tue, Wed, Thu, Fri, Sat, Sun (not alphabetical), hour of day (0–23) on x, each cell coloured by median latency in ms. Use realistic values with a weekday business-hours peak.”
Chart values were made up by Forma from each prompt. Drawn here from the returned spec.
In Forma Visuals
02 Figures
vector-graphics
Describe a drawing in plain language and get back vector source that has been checked against versioned rules before you see it.
| Format | Returns | Refuses rather than approximate |
|---|---|---|
| tikzdefault | TikZ source to typeset | Expresses the most |
| metapost | MetaPost source to typeset | Expresses as much as tikz |
| pictex | PicTeX source to typeset | Arbitrary stroke colours, fills, coloured text |
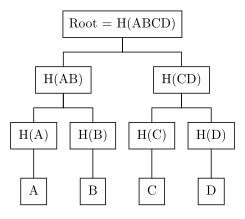
vector-graphics@c738bf88“A Merkle tree over four data blocks. Leaves: H(A), H(B), H(C), H(D) as boxes. Their parents: H(AB) above H(A) and H(B), H(CD) above H(C) and H(D). Root at the top: Root = H(ABCD). Draw it as a tree of boxes with edges from each parent to its children, and the four data blocks A, B, C, D as small boxes under their leaf hashes.”
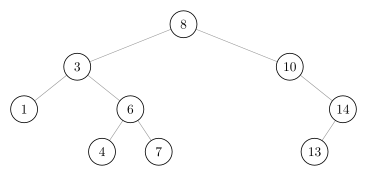
vector-graphics@c738bf88“A binary search tree built by inserting the keys 8, 3, 10, 1, 6, 14, 4, 7, 13 in that order. Draw each node as a circle labelled with its key, edges from parent to child, left children to the left and right children to the right.”
vector-graphics@c738bf88“Triangle ABC with the midpoints of each side, the three medians, and the centroid G where they meet; check that each median passes through G.”
Figures are TeX source: drawn here by Forma's figure engine from the returned TikZ. Describe a figure by what it is (a midpoint, an intersection, a tree from its structure) and the coordinates are worked out for you.
In Forma Visuals
03 Coverage policies
coverage-policy
Ask a question about the Medicare knee replacement policy (LCD L36575) and get back the rules, conditions and statements that answer it as JSON, each with the policy passage it comes from, checked against versioned rules before you see it.
| Format | Returns | Refuses rather than approximate |
|---|---|---|
| lookupdefault | The parts of LCD L36575 that answer the question, as JSON | Answers come from this one policy, even for questions about others |
An answer is a JSON document: the rules, conditions and statements of the Medicare knee replacement policy (LCD L36575) that answer the question, each with the passage it comes from, and what the policy does not mention. It records what the policy says and does not decide whether a patient qualifies.
04 What "verified" covers
- A valid artifact passed the version of the rules verified_by identifies.
- The same rules always carry the same identifier.
- A figure's stated checks hold in the figure you receive.
- An oracle in the catalogue is callable by your key, in any format it lists.
05 What it does not
- That the artifact is what you meant. The check covers form, not intent.
- That the data is real. Ask vaguely and Forma may invent values; send your data when the numbers matter.
- That your coordinates survive. Forma may move a point you gave it to make a stated check hold.
- The same answer twice. The same request can come back different; store the artifact you got.
- An answer at all. Some intents cannot be satisfied, and invalid is the honest result.