Models sound certain.
Ask a model for code, a configuration, a diagram or a report, and the answer comes back fluent and confident, whether it is right or not.
LLMs make things that look right. Forma hands back things that passed. In seconds, or with a plain no.
Starting with charts and figures · see what is live →
Recorded from production · 2026-10-01 · each step is a real call you can make
Read the catalogue rather than guess a name. Free.
list_oracles {}
→ 3 oracles · chart, vector-graphics, coverage-policy
The chart is checked against its rules, and against what Chart.js can draw, before it answers.
ask_oracle · chart · chartjs · the intent above
→ valid · chart@6baf09f0 · 1 credit
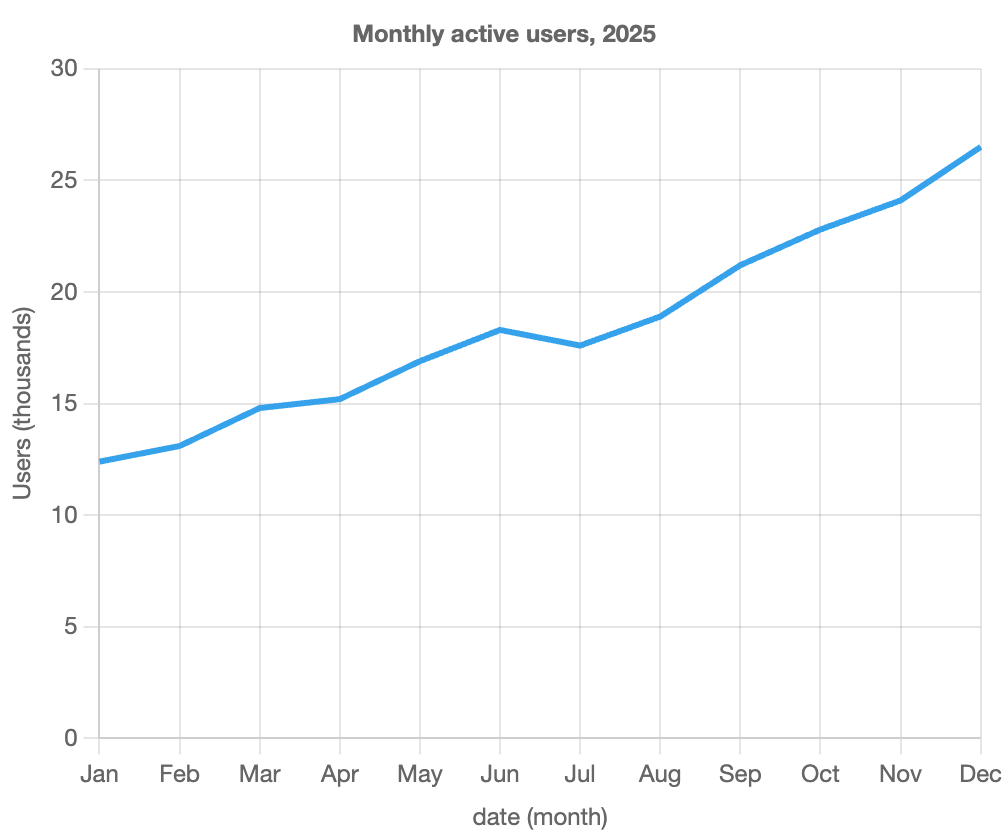
Drawn by Chart.js from the returned config. Chart.js is not drawn by Forma's servers: the answer is the config, and your page draws it. The numbers are the ones given in the prompt, January's 12.4 thousand to December's 26.5.
Recorded from production · 2026-09-30 · each step is a real call you can make
Read the catalogue rather than guess a name. Free.
list_oracles {}
→ 3 oracles · chart, vector-graphics, coverage-policy
The chart is checked against its rules, and against what Plotly can draw, before it answers.
ask_oracle · chart · plotly · the intent above
→ valid · chart@6baf09f0 · 1 credit
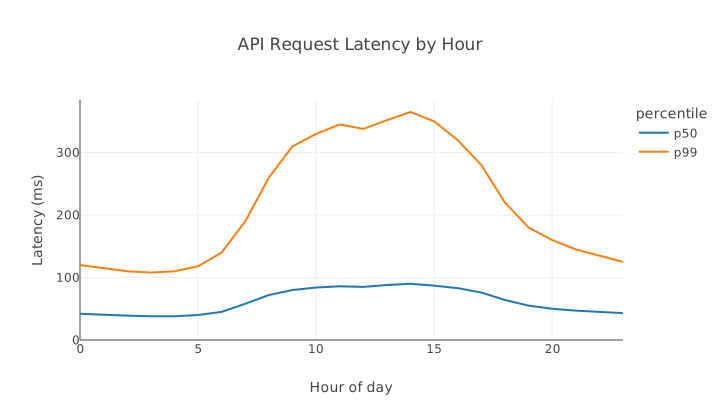
Drawn by Plotly from the returned figure. Plotly is not drawn by Forma's servers: the answer is the figure, and your page draws it. The numbers are the ones given in the prompt; p99 peaks at 365 ms at hour 14.
Recorded from production · 2026-09-30 · each step is a real call you can make
Read the catalogue rather than guess a name. Free.
list_oracles {}
→ 3 oracles · chart, vector-graphics, coverage-policy
Where each key goes is worked out for you, and the figure is held to its rules before Forma answers.
ask_oracle · vector-graphics · the intent above
→ valid · vector-graphics@c738bf88 · 1 credit
The answer says it is drawable, so the agent shows it.
show_figure {"figure_token":"fig_<token>"}
→ drawn inline, source on a second tab
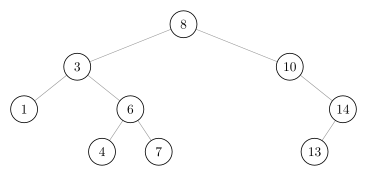
Drawn by Forma's figure engine from the returned TikZ. You can check it in the source: read the nodes left to right by x and the keys come out sorted, 1 3 4 6 7 8 10 13 14, which is what makes it a search tree.
01 Why Forma
Ask a model for code, a configuration, a diagram or a report, and the answer comes back fluent and confident, whether it is right or not.
So you check every answer by hand, or you ship it and hope nobody looks closely.
Every answer that passes says which version of the rules it passed. If it cannot pass, you are told, plainly.
Most answers come back in about two seconds. In our tests, frontier models took twenty to thirty to answer the same requests, unchecked.
Learn more →Every answer that passes carries the version of the rules it passed. If it cannot pass, you get a plain no and the reason, not something plausible and wrong.
Learn more →MCP for Claude, ChatGPT, Cursor, VS Code, Windsurf and Codex; HTTP and CI for code, where invalid fails the build; the console for people.
Learn more →One credit per answer, a cent each, however long the request. No token meter.
Learn more →02 Who it is for
Give an agent tools whose answers are checked, so it can act on them without a person reading every one.
Put model output into a product or a build with a verdict a program can act on: valid, invalid or error.
Reports, papers, docs, slides. When your name is on it, “it looked right” is not enough.
Keep the rules version with the output, and you can say later exactly which version it passed.
03 Live today
The first two products: charts in Vega-Lite, Plotly, ECharts, Chart.js or gnuplot, and figures in TikZ, MetaPost or PiCTeX. Each answer below is real, shown with the request that produced it, and every number in each chart's data is in its request. The tag beside each answer, such as chart@6baf09f0, is the version of the rules it passed.
“A line chart of monthly active users in 2025, months Jan to Dec in calendar order on x (not alphabetical), users in thou…”
valid · chart@6baf09f0
“Line chart of API request latency over one day, two lines: p50 and p99, in ms, by hour 0 to 23. p50: 42,40,39,38,38,40,4…”
valid · chart@6baf09f0
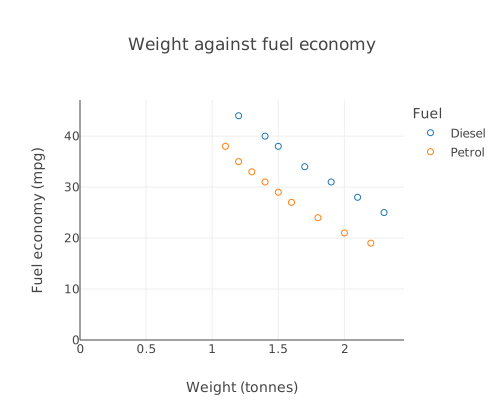
“A scatter plot of car weight against fuel economy, two groups as separately coloured marker series with a legend. Petrol…”
valid · chart@6baf09f0
“A binary search tree built by inserting the keys 8, 3, 10, 1, 6, 14, 4, 7, 13 in that order. Draw each node as a circle…”
valid · vector-graphics@c738bf88
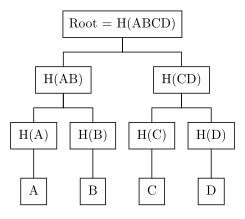
“A Merkle tree over four data blocks. Leaves: H(A), H(B), H(C), H(D) as boxes. Their parents: H(AB) above H(A) and H(B),…”
valid · vector-graphics@c738bf88
“Triangle ABC with the midpoints of each side, the three medians, and the centroid G where they meet; check that each med…”
valid · vector-graphics@c738bf88
These are the first two. What should Forma check next? Tell us what your models write.
04 Limits
What “valid” means: the check covers form, not intent. A valid chart of the wrong column is still valid. Real answers, two valid and one refused:
| Asked | Got | So |
|---|---|---|
| “Make me a chart about how things are going.” | valid · chart@6baf09f0a line chart of five weeks of counts | Captured before the API refused such requests by default: Forma made the numbers up. Today the API refuses it with DATA_REQUIRED, unbilled, unless generated data is allowed, as the console allows it. |
| “Make me a chart about how things are going.” | refused · DATA_REQUIRED“This chart needs values the request does not contain. Put them in the intent, or set allow_generated_data to true for illustrative values.” HTTP 422, not billed · 2026-10-07 | The same request today, sent to the API with its default setting: a plain no and the reason, instead of numbers Forma made up. |
| “Points A at (0,0), B at (4,0) and C at (2,1). Draw segment AB and point C, and check that A, B and C are collinear.” | valid · vector-graphics@c738bf88C drawn on AB, not above it | The check holds in the figure returned, but Forma moved a coordinate you gave it to make it hold. Read the source before trusting the picture. |
$0.01
valid · invalid
error
never expire
05 Start
Free plan: 20 calls a month, every product, every format. Try it in the console, or connect your agent with one line and sign in when it asks.
claude mcp add --transport http forma https://mcp.formalogic.io/mcp