Can the spec load data from a URL?
No. The data must be written into the spec, under data.values. A spec that names a url is refused with the address it would have loaded, so you can paste the values instead.
Tools · Vega-Lite
Paste a Vega-Lite specification and get the chart back as SVG or PNG. Layers, transforms, regression lines and every mark type are drawn by Vega itself, server-side, so the file is the same on every machine.
Or describe it in words and get source you can edit, checked before you see it.
Part of Forma Visuals: Chart your data · For analysts
Stacked bar chart Electricity generated by coal, gas, wind and solar over five years, stacked in a fixed order with a calculate transform and the order channel, so wind overtaking gas is plain to see.
In your browser, drawn with Plotly.js (MIT), Apache ECharts (Apache-2.0, notice), Chart.js (MIT).
01 Examples
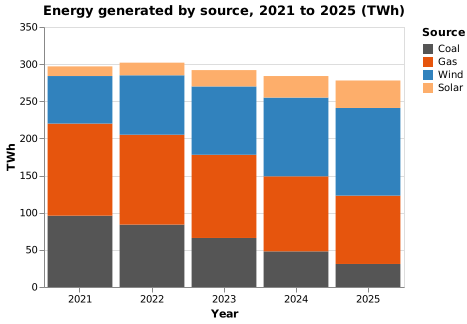
Electricity generated by coal, gas, wind and solar over five years, stacked in a fixed order with a calculate transform and the order channel, so wind overtaking gas is plain to see.
{
  "$schema": "https://vega.github.io/schema/vega-lite/v6.json",
  "title": "Energy generated by source, 2021 to 2025 (TWh)",
  "width": 360,
  "height": 260,
  "data": {
    "values": [
      {
        "year": "2021",
        "source": "Coal",
        "twh": 96
      },
      {
        "year": "2021",
        "source": "Gas",
        "twh": 124
      },
      {
        "year": "2021",
        "source": "Wind",
        "twh": 64
      },
      {
        "year": "2021",
        "source": "Solar",
        "twh": 13
      },
      {
        "year": "2022",
        "source": "Coal",
        "twh": 84
      },
      {
        "year": "2022",
        "source": "Gas",
        "twh": 121
      },
      {
        "year": "2022",
        "source": "Wind",
        "twh": 80
      },
      {
        "year": "2022",
        "source": "Solar",
        "twh": 17
      },
      {
        "year": "2023",
        "source": "Coal",
        "twh": 66
      },
      {
        "year": "2023",
        "source": "Gas",
        "twh": 112
      },
      {
        "year": "2023",
        "source": "Wind",
        "twh": 92
      },
      {
        "year": "2023",
        "source": "Solar",
        "twh": 22
      },
      {
        "year": "2024",
        "source": "Coal",
        "twh": 48
      },
      {
        "year": "2024",
        "source": "Gas",
        "twh": 101
      },
      {
        "year": "2024",
        "source": "Wind",
        "twh": 106
      },
      {
        "year": "2024",
        "source": "Solar",
        "twh": 29
      },
      {
        "year": "2025",
        "source": "Coal",
        "twh": 31
      },
      {
        "year": "2025",
        "source": "Gas",
        "twh": 92
      },
      {
        "year": "2025",
        "source": "Wind",
        "twh": 118
      },
      {
        "year": "2025",
        "source": "Solar",
        "twh": 37
      }
    ]
  },
  "transform": [
    {
      "calculate": "indexof(['Coal', 'Gas', 'Wind', 'Solar'], datum.source)",
      "as": "stack_order"
    }
  ],
  "mark": "bar",
  "encoding": {
    "x": {
      "field": "year",
      "type": "ordinal",
      "title": "Year",
      "axis": {
        "labelAngle": 0
      }
    },
    "y": {
      "field": "twh",
      "type": "quantitative",
      "stack": "zero",
      "title": "TWh"
    },
    "color": {
      "field": "source",
      "type": "nominal",
      "title": "Source",
      "scale": {
        "domain": [
          "Coal",
          "Gas",
          "Wind",
          "Solar"
        ],
        "range": [
          "#555555",
          "#e6550d",
          "#3182bd",
          "#fdae6b"
        ]
      }
    },
    "order": {
      "field": "stack_order",
      "sort": "ascending"
    }
  }
}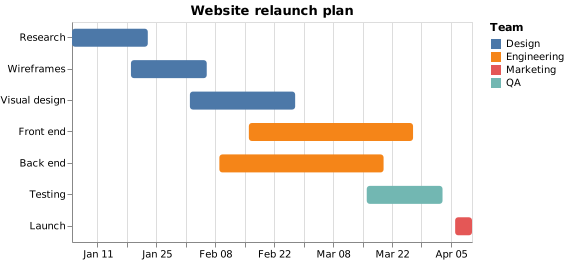
A project plan as a Vega-Lite Gantt chart: one bar per task from its start date (x) to its end date (x2), coloured by team, with tasks kept in plan order by sort: null.
{
  "$schema": "https://vega.github.io/schema/vega-lite/v6.json",
  "title": "Website relaunch plan",
  "width": 400,
  "height": 220,
  "data": {
    "values": [
      {
        "task": "Research",
        "start": "2026-01-05",
        "end": "2026-01-23",
        "team": "Design"
      },
      {
        "task": "Wireframes",
        "start": "2026-01-19",
        "end": "2026-02-06",
        "team": "Design"
      },
      {
        "task": "Visual design",
        "start": "2026-02-02",
        "end": "2026-02-27",
        "team": "Design"
      },
      {
        "task": "Front end",
        "start": "2026-02-16",
        "end": "2026-03-27",
        "team": "Engineering"
      },
      {
        "task": "Back end",
        "start": "2026-02-09",
        "end": "2026-03-20",
        "team": "Engineering"
      },
      {
        "task": "Testing",
        "start": "2026-03-16",
        "end": "2026-04-03",
        "team": "QA"
      },
      {
        "task": "Launch",
        "start": "2026-04-06",
        "end": "2026-04-10",
        "team": "Marketing"
      }
    ]
  },
  "mark": {
    "type": "bar",
    "cornerRadius": 3,
    "height": 18
  },
  "encoding": {
    "y": {
      "field": "task",
      "type": "ordinal",
      "sort": null,
      "title": null
    },
    "x": {
      "field": "start",
      "type": "temporal",
      "title": null,
      "axis": {
        "format": "%b %d"
      }
    },
    "x2": {
      "field": "end"
    },
    "color": {
      "field": "team",
      "type": "nominal",
      "title": "Team"
    }
  }
}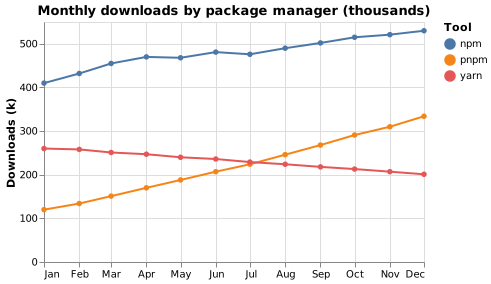
Monthly downloads for three package managers as one line per series, split by the color channel, with points on each line and a temporal x axis by month. Illustrative data.
{
  "$schema": "https://vega.github.io/schema/vega-lite/v6.json",
  "title": "Monthly downloads by package manager (thousands)",
  "width": 380,
  "height": 240,
  "data": {
    "values": [
      {
        "month": "2025-01",
        "tool": "npm",
        "k": 410
      },
      {
        "month": "2025-02",
        "tool": "npm",
        "k": 432
      },
      {
        "month": "2025-03",
        "tool": "npm",
        "k": 455
      },
      {
        "month": "2025-04",
        "tool": "npm",
        "k": 470
      },
      {
        "month": "2025-05",
        "tool": "npm",
        "k": 468
      },
      {
        "month": "2025-06",
        "tool": "npm",
        "k": 481
      },
      {
        "month": "2025-07",
        "tool": "npm",
        "k": 476
      },
      {
        "month": "2025-08",
        "tool": "npm",
        "k": 490
      },
      {
        "month": "2025-09",
        "tool": "npm",
        "k": 502
      },
      {
        "month": "2025-10",
        "tool": "npm",
        "k": 515
      },
      {
        "month": "2025-11",
        "tool": "npm",
        "k": 521
      },
      {
        "month": "2025-12",
        "tool": "npm",
        "k": 530
      },
      {
        "month": "2025-01",
        "tool": "pnpm",
        "k": 120
      },
      {
        "month": "2025-02",
        "tool": "pnpm",
        "k": 134
      },
      {
        "month": "2025-03",
        "tool": "pnpm",
        "k": 151
      },
      {
        "month": "2025-04",
        "tool": "pnpm",
        "k": 170
      },
      {
        "month": "2025-05",
        "tool": "pnpm",
        "k": 188
      },
      {
        "month": "2025-06",
        "tool": "pnpm",
        "k": 207
      },
      {
        "month": "2025-07",
        "tool": "pnpm",
        "k": 224
      },
      {
        "month": "2025-08",
        "tool": "pnpm",
        "k": 246
      },
      {
        "month": "2025-09",
        "tool": "pnpm",
        "k": 268
      },
      {
        "month": "2025-10",
        "tool": "pnpm",
        "k": 291
      },
      {
        "month": "2025-11",
        "tool": "pnpm",
        "k": 310
      },
      {
        "month": "2025-12",
        "tool": "pnpm",
        "k": 334
      },
      {
        "month": "2025-01",
        "tool": "yarn",
        "k": 260
      },
      {
        "month": "2025-02",
        "tool": "yarn",
        "k": 258
      },
      {
        "month": "2025-03",
        "tool": "yarn",
        "k": 251
      },
      {
        "month": "2025-04",
        "tool": "yarn",
        "k": 247
      },
      {
        "month": "2025-05",
        "tool": "yarn",
        "k": 240
      },
      {
        "month": "2025-06",
        "tool": "yarn",
        "k": 236
      },
      {
        "month": "2025-07",
        "tool": "yarn",
        "k": 229
      },
      {
        "month": "2025-08",
        "tool": "yarn",
        "k": 224
      },
      {
        "month": "2025-09",
        "tool": "yarn",
        "k": 218
      },
      {
        "month": "2025-10",
        "tool": "yarn",
        "k": 213
      },
      {
        "month": "2025-11",
        "tool": "yarn",
        "k": 207
      },
      {
        "month": "2025-12",
        "tool": "yarn",
        "k": 201
      }
    ]
  },
  "mark": {
    "type": "line",
    "point": true,
    "strokeWidth": 2
  },
  "encoding": {
    "x": {
      "field": "month",
      "type": "temporal",
      "timeUnit": "yearmonth",
      "title": null,
      "axis": {
        "format": "%b"
      }
    },
    "y": {
      "field": "k",
      "type": "quantitative",
      "title": "Downloads (k)"
    },
    "color": {
      "field": "tool",
      "type": "nominal",
      "title": "Tool"
    }
  }
}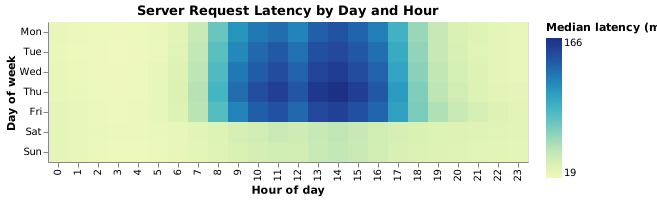
Median request latency for every hour of the week, days in calendar order, so the weekday rush and the quiet nights stand out at a glance.
A real answer from Forma's chart oracle, verified by chart@6baf09f0.
{
"$schema": "https://vega.github.io/schema/vega-lite/v6.json",
"name": "server_latency",
"data": {
"values": [
{
"day": "Mon",
"hour": 0,
"latency": 24
},
{
"day": "Mon",
"hour": 1,
"latency": 22
},
{
"day": "Mon",
"hour": 2,
"latency": 21
},
{
"day": "Mon",
"hour": 3,
"latency": 20
},
{
"day": "Mon",
"hour": 4,
"latency": 21
},
{
"day": "Mon",
"hour": 5,
"latency": 23
},
{
"day": "Mon",
"hour": 6,
"latency": 28
},
{
"day": "Mon",
"hour": 7,
"latency": 42
},
{
"day": "Mon",
"hour": 8,
"latency": 78
},
{
"day": "Mon",
"hour": 9,
"latency": 112
},
{
"day": "Mon",
"hour": 10,
"latency": 126
},
{
"day": "Mon",
"hour": 11,
"latency": 132
},
{
"day": "Mon",
"hour": 12,
"latency": 121
},
{
"day": "Mon",
"hour": 13,
"latency": 138
},
{
"day": "Mon",
"hour": 14,
"latency": 145
},
{
"day": "Mon",
"hour": 15,
"latency": 136
},
{
"day": "Mon",
"hour": 16,
"latency": 124
},
{
"day": "Mon",
"hour": 17,
"latency": 94
},
{
"day": "Mon",
"hour": 18,
"latency": 61
},
{
"day": "Mon",
"hour": 19,
"latency": 43
},
{
"day": "Mon",
"hour": 20,
"latency": 34
},
{
"day": "Mon",
"hour": 21,
"latency": 30
},
{
"day": "Mon",
"hour": 22,
"latency": 27
},
{
"day": "Mon",
"hour": 23,
"latency": 25
},
{
"day": "Tue",
"hour": 0,
"latency": 23
},
{
"day": "Tue",
"hour": 1,
"latency": 21
},
{
"day": "Tue",
"hour": 2,
"latency": 20
},
{
"day": "Tue",
"hour": 3,
"latency": 19
},
{
"day": "Tue",
"hour": 4,
"latency": 20
},
{
"day": "Tue",
"hour": 5,
"latency": 22
},
{
"day": "Tue",
"hour": 6,
"latency": 29
},
{
"day": "Tue",
"hour": 7,
"latency": 45
},
{
"day": "Tue",
"hour": 8,
"latency": 83
},
{
"day": "Tue",
"hour": 9,
"latency": 118
},
{
"day": "Tue",
"hour": 10,
"latency": 134
},
{
"day": "Tue",
"hour": 11,
"latency": 142
},
{
"day": "Tue",
"hour": 12,
"latency": 130
},
{
"day": "Tue",
"hour": 13,
"latency": 147
},
{
"day": "Tue",
"hour": 14,
"latency": 151
},
{
"day": "Tue",
"hour": 15,
"latency": 143
},
{
"day": "Tue",
"hour": 16,
"latency": 131
},
{
"day": "Tue",
"hour": 17,
"latency": 99
},
{
"day": "Tue",
"hour": 18,
"latency": 64
},
{
"day": "Tue",
"hour": 19,
"latency": 44
},
{
"day": "Tue",
"hour": 20,
"latency": 35
},
{
"day": "Tue",
"hour": 21,
"latency": 29
},
{
"day": "Tue",
"hour": 22,
"latency": 26
},
{
"day": "Tue",
"hour": 23,
"latency": 24
},
{
"day": "Wed",
"hour": 0,
"latency": 24
},
{
"day": "Wed",
"hour": 1,
"latency": 22
},
{
"day": "Wed",
"hour": 2,
"latency": 20
},
{
"day": "Wed",
"hour": 3,
"latency": 20
},
{
"day": "Wed",
"hour": 4,
"latency": 21
},
{
"day": "Wed",
"hour": 5,
"latency": 24
},
{
"day": "Wed",
"hour": 6,
"latency": 31
},
{
"day": "Wed",
"hour": 7,
"latency": 48
},
{
"day": "Wed",
"hour": 8,
"latency": 88
},
{
"day": "Wed",
"hour": 9,
"latency": 126
},
{
"day": "Wed",
"hour": 10,
"latency": 141
},
{
"day": "Wed",
"hour": 11,
"latency": 149
},
{
"day": "Wed",
"hour": 12,
"latency": 137
},
{
"day": "Wed",
"hour": 13,
"latency": 153
},
{
"day": "Wed",
"hour": 14,
"latency": 158
},
{
"day": "Wed",
"hour": 15,
"latency": 149
},
{
"day": "Wed",
"hour": 16,
"latency": 137
},
{
"day": "Wed",
"hour": 17,
"latency": 103
},
{
"day": "Wed",
"hour": 18,
"latency": 67
},
{
"day": "Wed",
"hour": 19,
"latency": 46
},
{
"day": "Wed",
"hour": 20,
"latency": 36
},
{
"day": "Wed",
"hour": 21,
"latency": 31
},
{
"day": "Wed",
"hour": 22,
"latency": 27
},
{
"day": "Wed",
"hour": 23,
"latency": 25
},
{
"day": "Thu",
"hour": 0,
"latency": 25
},
{
"day": "Thu",
"hour": 1,
"latency": 23
},
{
"day": "Thu",
"hour": 2,
"latency": 21
},
{
"day": "Thu",
"hour": 3,
"latency": 20
},
{
"day": "Thu",
"hour": 4,
"latency": 21
},
{
"day": "Thu",
"hour": 5,
"latency": 25
},
{
"day": "Thu",
"hour": 6,
"latency": 33
},
{
"day": "Thu",
"hour": 7,
"latency": 51
},
{
"day": "Thu",
"hour": 8,
"latency": 92
},
{
"day": "Thu",
"hour": 9,
"latency": 132
},
{
"day": "Thu",
"hour": 10,
"latency": 148
},
{
"day": "Thu",
"hour": 11,
"latency": 156
},
{
"day": "Thu",
"hour": 12,
"latency": 144
},
{
"day": "Thu",
"hour": 13,
"latency": 161
},
{
"day": "Thu",
"hour": 14,
"latency": 166
},
{
"day": "Thu",
"hour": 15,
"latency": 157
},
{
"day": "Thu",
"hour": 16,
"latency": 143
},
{
"day": "Thu",
"hour": 17,
"latency": 108
},
{
"day": "Thu",
"hour": 18,
"latency": 70
},
{
"day": "Thu",
"hour": 19,
"latency": 48
},
{
"day": "Thu",
"hour": 20,
"latency": 38
},
{
"day": "Thu",
"hour": 21,
"latency": 32
},
{
"day": "Thu",
"hour": 22,
"latency": 28
},
{
"day": "Thu",
"hour": 23,
"latency": 26
},
{
"day": "Fri",
"hour": 0,
"latency": 26
},
{
"day": "Fri",
"hour": 1,
"latency": 24
},
{
"day": "Fri",
"hour": 2,
"latency": 22
},
{
"day": "Fri",
"hour": 3,
"latency": 21
},
{
"day": "Fri",
"hour": 4,
"latency": 22
},
{
"day": "Fri",
"hour": 5,
"latency": 25
},
{
"day": "Fri",
"hour": 6,
"latency": 32
},
{
"day": "Fri",
"hour": 7,
"latency": 49
},
{
"day": "Fri",
"hour": 8,
"latency": 86
},
{
"day": "Fri",
"hour": 9,
"latency": 121
},
{
"day": "Fri",
"hour": 10,
"latency": 139
},
{
"day": "Fri",
"hour": 11,
"latency": 146
},
{
"day": "Fri",
"hour": 12,
"latency": 134
},
{
"day": "Fri",
"hour": 13,
"latency": 151
},
{
"day": "Fri",
"hour": 14,
"latency": 155
},
{
"day": "Fri",
"hour": 15,
"latency": 147
},
{
"day": "Fri",
"hour": 16,
"latency": 135
},
{
"day": "Fri",
"hour": 17,
"latency": 105
},
{
"day": "Fri",
"hour": 18,
"latency": 72
},
{
"day": "Fri",
"hour": 19,
"latency": 53
},
{
"day": "Fri",
"hour": 20,
"latency": 42
},
{
"day": "Fri",
"hour": 21,
"latency": 36
},
{
"day": "Fri",
"hour": 22,
"latency": 31
},
{
"day": "Fri",
"hour": 23,
"latency": 28
},
{
"day": "Sat",
"hour": 0,
"latency": 27
},
{
"day": "Sat",
"hour": 1,
"latency": 25
},
{
"day": "Sat",
"hour": 2,
"latency": 23
},
{
"day": "Sat",
"hour": 3,
"latency": 22
},
{
"day": "Sat",
"hour": 4,
"latency": 22
},
{
"day": "Sat",
"hour": 5,
"latency": 23
},
{
"day": "Sat",
"hour": 6,
"latency": 25
},
{
"day": "Sat",
"hour": 7,
"latency": 28
},
{
"day": "Sat",
"hour": 8,
"latency": 32
},
{
"day": "Sat",
"hour": 9,
"latency": 36
},
{
"day": "Sat",
"hour": 10,
"latency": 39
},
{
"day": "Sat",
"hour": 11,
"latency": 42
},
{
"day": "Sat",
"hour": 12,
"latency": 40
},
{
"day": "Sat",
"hour": 13,
"latency": 44
},
{
"day": "Sat",
"hour": 14,
"latency": 47
},
{
"day": "Sat",
"hour": 15,
"latency": 43
},
{
"day": "Sat",
"hour": 16,
"latency": 39
},
{
"day": "Sat",
"hour": 17,
"latency": 36
},
{
"day": "Sat",
"hour": 18,
"latency": 34
},
{
"day": "Sat",
"hour": 19,
"latency": 32
},
{
"day": "Sat",
"hour": 20,
"latency": 31
},
{
"day": "Sat",
"hour": 21,
"latency": 30
},
{
"day": "Sat",
"hour": 22,
"latency": 29
},
{
"day": "Sat",
"hour": 23,
"latency": 28
},
{
"day": "Sun",
"hour": 0,
"latency": 26
},
{
"day": "Sun",
"hour": 1,
"latency": 24
},
{
"day": "Sun",
"hour": 2,
"latency": 22
},
{
"day": "Sun",
"hour": 3,
"latency": 21
},
{
"day": "Sun",
"hour": 4,
"latency": 21
},
{
"day": "Sun",
"hour": 5,
"latency": 22
},
{
"day": "Sun",
"hour": 6,
"latency": 24
},
{
"day": "Sun",
"hour": 7,
"latency": 27
},
{
"day": "Sun",
"hour": 8,
"latency": 30
},
{
"day": "Sun",
"hour": 9,
"latency": 34
},
{
"day": "Sun",
"hour": 10,
"latency": 37
},
{
"day": "Sun",
"hour": 11,
"latency": 39
},
{
"day": "Sun",
"hour": 12,
"latency": 38
},
{
"day": "Sun",
"hour": 13,
"latency": 42
},
{
"day": "Sun",
"hour": 14,
"latency": 45
},
{
"day": "Sun",
"hour": 15,
"latency": 42
},
{
"day": "Sun",
"hour": 16,
"latency": 38
},
{
"day": "Sun",
"hour": 17,
"latency": 35
},
{
"day": "Sun",
"hour": 18,
"latency": 33
},
{
"day": "Sun",
"hour": 19,
"latency": 31
},
{
"day": "Sun",
"hour": 20,
"latency": 30
},
{
"day": "Sun",
"hour": 21,
"latency": 29
},
{
"day": "Sun",
"hour": 22,
"latency": 28
},
{
"day": "Sun",
"hour": 23,
"latency": 27
}
]
},
"title": "Server Request Latency by Day and Hour",
"mark": "rect",
"encoding": {
"x": {
"field": "hour",
"type": "ordinal",
"axis": {
"title": "Hour of day"
}
},
"y": {
"field": "day",
"type": "ordinal",
"scale": {
"domain": [
"Mon",
"Tue",
"Wed",
"Thu",
"Fri",
"Sat",
"Sun"
]
},
"axis": {
"title": "Day of week"
}
},
"color": {
"field": "latency",
"type": "quantitative",
"legend": {
"title": "Median latency (ms)"
}
}
}
}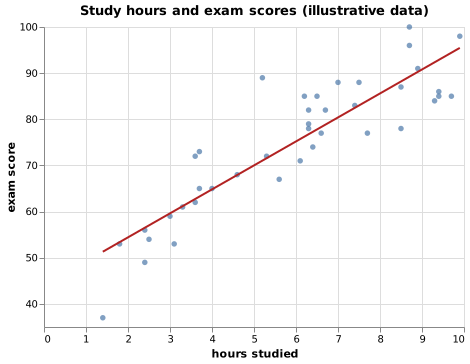
Forty points with a least-squares line fitted by Vega-Lite's own regression transform and layered over the scatter. The data is illustrative.
{
  "title": "Study hours and exam scores (illustrative data)",
  "data": {
    "values": [
      {
        "hours": 3.1,
        "score": 53
      },
      {
        "hours": 6.4,
        "score": 74
      },
      {
        "hours": 6.6,
        "score": 77
      },
      {
        "hours": 8.5,
        "score": 87
      },
      {
        "hours": 3.3,
        "score": 61
      },
      {
        "hours": 5.2,
        "score": 89
      },
      {
        "hours": 8.5,
        "score": 78
      },
      {
        "hours": 2.4,
        "score": 56
      },
      {
        "hours": 6.7,
        "score": 82
      },
      {
        "hours": 7.7,
        "score": 77
      },
      {
        "hours": 7.0,
        "score": 88
      },
      {
        "hours": 6.3,
        "score": 79
      },
      {
        "hours": 3.7,
        "score": 73
      },
      {
        "hours": 5.3,
        "score": 72
      },
      {
        "hours": 7.5,
        "score": 88
      },
      {
        "hours": 9.3,
        "score": 84
      },
      {
        "hours": 4.6,
        "score": 68
      },
      {
        "hours": 9.4,
        "score": 85
      },
      {
        "hours": 8.9,
        "score": 91
      },
      {
        "hours": 3.0,
        "score": 59
      },
      {
        "hours": 9.7,
        "score": 85
      },
      {
        "hours": 3.7,
        "score": 65
      },
      {
        "hours": 5.6,
        "score": 67
      },
      {
        "hours": 6.3,
        "score": 78
      },
      {
        "hours": 6.3,
        "score": 82
      },
      {
        "hours": 9.4,
        "score": 86
      },
      {
        "hours": 8.7,
        "score": 96
      },
      {
        "hours": 2.5,
        "score": 54
      },
      {
        "hours": 8.7,
        "score": 100
      },
      {
        "hours": 6.1,
        "score": 71
      },
      {
        "hours": 7.4,
        "score": 83
      },
      {
        "hours": 6.2,
        "score": 85
      },
      {
        "hours": 3.6,
        "score": 72
      },
      {
        "hours": 9.9,
        "score": 98
      },
      {
        "hours": 1.8,
        "score": 53
      },
      {
        "hours": 2.4,
        "score": 49
      },
      {
        "hours": 3.6,
        "score": 62
      },
      {
        "hours": 1.4,
        "score": 37
      },
      {
        "hours": 6.5,
        "score": 85
      },
      {
        "hours": 4.0,
        "score": 65
      }
    ]
  },
  "width": 420,
  "height": 300,
  "layer": [
    {
      "mark": {
        "type": "point",
        "filled": true,
        "opacity": 0.7
      },
      "encoding": {
        "x": {
          "field": "hours",
          "type": "quantitative",
          "title": "hours studied"
        },
        "y": {
          "field": "score",
          "type": "quantitative",
          "scale": {
            "zero": false
          },
          "title": "exam score"
        }
      }
    },
    {
      "mark": {
        "type": "line",
        "color": "firebrick",
        "strokeWidth": 2
      },
      "transform": [
        {
          "regression": "score",
          "on": "hours"
        }
      ],
      "encoding": {
        "x": {
          "field": "hours",
          "type": "quantitative"
        },
        "y": {
          "field": "score",
          "type": "quantitative"
        }
      }
    }
  ]
}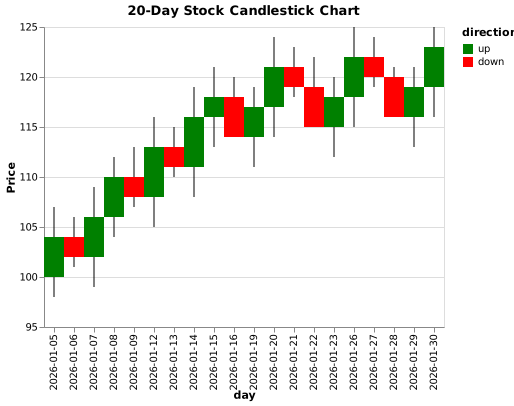
Twenty trading days of open, high, low and close as candlesticks coloured by direction, built from Vega-Lite rule and bar marks layered together.
A real answer from Forma's chart oracle, verified by chart@6baf09f0.
{
  "$schema": "https://vega.github.io/schema/vega-lite/v6.json",
  "name": "stock_candlestick",
  "data": {
    "values": [
      {
        "day": "2026-01-05",
        "low": 98,
        "open": 100,
        "close": 104,
        "high": 107,
        "direction": "up"
      },
      {
        "day": "2026-01-06",
        "low": 101,
        "open": 104,
        "close": 102,
        "high": 106,
        "direction": "down"
      },
      {
        "day": "2026-01-07",
        "low": 99,
        "open": 102,
        "close": 106,
        "high": 109,
        "direction": "up"
      },
      {
        "day": "2026-01-08",
        "low": 104,
        "open": 106,
        "close": 110,
        "high": 112,
        "direction": "up"
      },
      {
        "day": "2026-01-09",
        "low": 107,
        "open": 110,
        "close": 108,
        "high": 113,
        "direction": "down"
      },
      {
        "day": "2026-01-12",
        "low": 105,
        "open": 108,
        "close": 113,
        "high": 116,
        "direction": "up"
      },
      {
        "day": "2026-01-13",
        "low": 110,
        "open": 113,
        "close": 111,
        "high": 115,
        "direction": "down"
      },
      {
        "day": "2026-01-14",
        "low": 108,
        "open": 111,
        "close": 116,
        "high": 119,
        "direction": "up"
      },
      {
        "day": "2026-01-15",
        "low": 113,
        "open": 116,
        "close": 118,
        "high": 121,
        "direction": "up"
      },
      {
        "day": "2026-01-16",
        "low": 115,
        "open": 118,
        "close": 114,
        "high": 120,
        "direction": "down"
      },
      {
        "day": "2026-01-19",
        "low": 111,
        "open": 114,
        "close": 117,
        "high": 119,
        "direction": "up"
      },
      {
        "day": "2026-01-20",
        "low": 114,
        "open": 117,
        "close": 121,
        "high": 124,
        "direction": "up"
      },
      {
        "day": "2026-01-21",
        "low": 118,
        "open": 121,
        "close": 119,
        "high": 123,
        "direction": "down"
      },
      {
        "day": "2026-01-22",
        "low": 116,
        "open": 119,
        "close": 115,
        "high": 122,
        "direction": "down"
      },
      {
        "day": "2026-01-23",
        "low": 112,
        "open": 115,
        "close": 118,
        "high": 120,
        "direction": "up"
      },
      {
        "day": "2026-01-26",
        "low": 115,
        "open": 118,
        "close": 122,
        "high": 125,
        "direction": "up"
      },
      {
        "day": "2026-01-27",
        "low": 119,
        "open": 122,
        "close": 120,
        "high": 124,
        "direction": "down"
      },
      {
        "day": "2026-01-28",
        "low": 117,
        "open": 120,
        "close": 116,
        "high": 121,
        "direction": "down"
      },
      {
        "day": "2026-01-29",
        "low": 113,
        "open": 116,
        "close": 119,
        "high": 121,
        "direction": "up"
      },
      {
        "day": "2026-01-30",
        "low": 116,
        "open": 119,
        "close": 123,
        "high": 125,
        "direction": "up"
      }
    ]
  },
  "title": "20-Day Stock Candlestick Chart",
  "layer": [
    {
      "mark": {
        "type": "rule",
        "size": 1
      },
      "encoding": {
        "x": {
          "field": "day",
          "type": "ordinal"
        },
        "y": {
          "field": "low",
          "type": "quantitative",
          "scale": {
            "zero": false,
            "domain": [
              95,
              125
            ]
          },
          "axis": {
            "title": "Price"
          }
        },
        "y2": {
          "field": "high",
          "type": "quantitative"
        }
      }
    },
    {
      "mark": "bar",
      "encoding": {
        "x": {
          "field": "day",
          "type": "ordinal"
        },
        "y": {
          "field": "open",
          "type": "quantitative",
          "scale": {
            "zero": false,
            "domain": [
              95,
              125
            ]
          },
          "axis": {
            "title": "Price"
          }
        },
        "y2": {
          "field": "close",
          "type": "quantitative"
        },
        "color": {
          "field": "direction",
          "type": "nominal",
          "scale": {
            "domain": [
              "up",
              "down"
            ],
            "range": [
              "green",
              "red"
            ]
          }
        }
      }
    }
  ]
}02 About Vega-Lite
Vega-Lite describes a chart as JSON: data, a mark, and how fields map to position, colour and size. From that it works out scales, axes and legends, which makes it a compact way to write charts that tools and language models can both produce.
No. The data must be written into the spec, under data.values. A spec that names a url is refused with the address it would have loaded, so you can paste the values instead.
The output is a static image, so selections and tooltips are kept in the spec but do not appear in the file. Everything visible on first draw is there.
Vega-Lite 6 through vl-convert, the renderer Forma uses for its own Vega-Lite answers.