Lines of best fit
A line Forma works out for you is not checked. Work out the fit yourself, then give the line's two ends in the request, as the example does; those numbers are then checked like the rest.
Forma Visuals · Chart your data · For students and scientists
Paste your measurements, say the plot you need, and get it back as a chart or a gnuplot script. Over the API and MCP, by default, Forma refuses a chart whose data holds a number you did not give it.
The playground allows illustrative values: any number your request does not give, Forma writes, and the answer says generated. Over the API and MCP, that request is refused unless it sets allow_generated_data.
01 Real answers
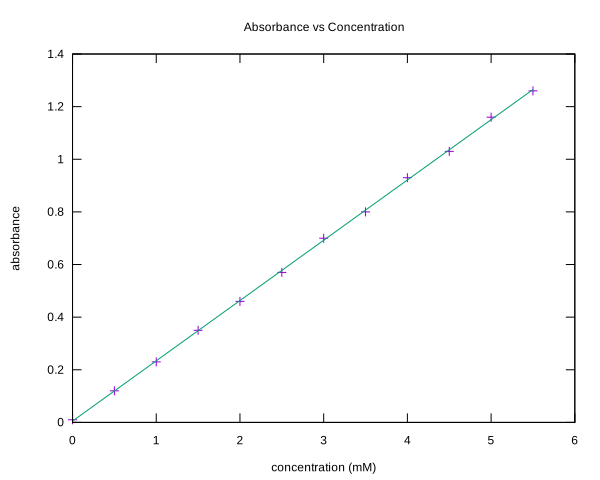
Twelve measurements and a straight line for a lab report, as a gnuplot script you can run and edit.
gnuplot
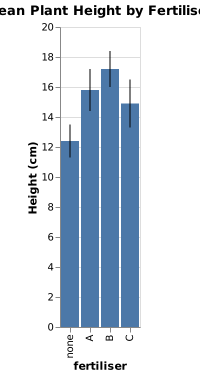
Group means as bars, with error bars from the low and high values in the request, for a report or a poster.
Vega-Lite
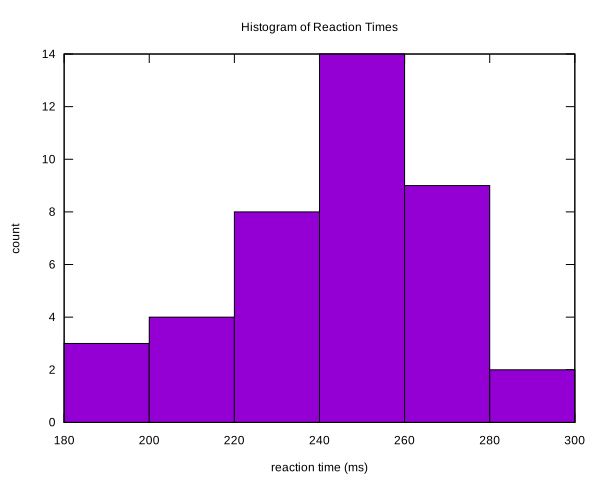
Forty measurements, binned, for the results section of a lab report, as a gnuplot script you can run and edit.
gnuplot
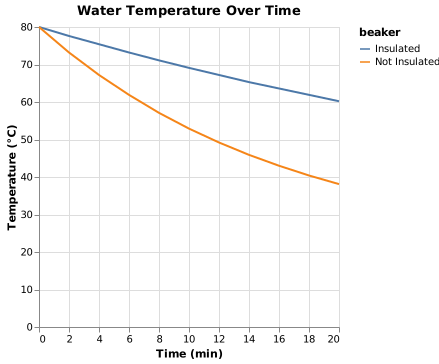
Two conditions measured over the same times, one line each, for the classic cooling experiment.
Vega-Lite
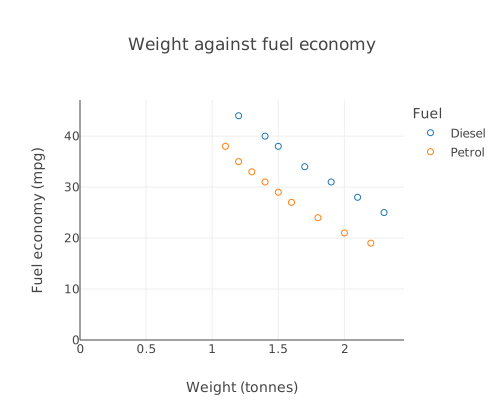
“A scatter plot of car weight against fuel economy, two groups as separately coloured marker series with a legend. Petrol cars (weight in tonnes, mpg): (1.1, 38), (1.2, 35), (1.3, 33), (1.4, 31), (1.5, 29), (1.6, 27), (1.8, 24), (2.0, 21), (2.2, 19). Diesel cars: (1.2, 44), (1.4, 40), (1.5, 38), (1.7, 34), (1.9, 31), (2.1, 28), (2.3, 25). x axis: weight (tonnes), y axis: fuel economy (mpg). Title: Weight against fuel economy.”
valid · chart@6baf09f0
Try these with their values filled in:
The playground allows illustrative values: any number your request does not give, Forma writes, and the answer says generated. Over the API and MCP, that request is refused unless it sets allow_generated_data.
02 How it fits
A line Forma works out for you is not checked. Work out the fit yourself, then give the line's two ends in the request, as the example does; those numbers are then checked like the rest.
Run the gnuplot script yourself, or paste the code into the free editors, which download SVG and PNG.
03 What you still check
04 Questions
Say them in the request, such as “x axis: concentration (mM)”. Labels are not compared with your request, so read them before you hand it in.
Yes. Give each low and high value in the request, as the example does, so the bars are drawn from your numbers.