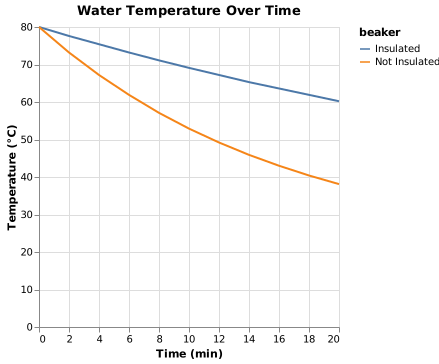
Line chart of water temperature in two beakers, insulated and not insulated, every 2 minutes for 20 minutes. time (min): 0, 2, 4, 6, 8, 10, 12, 14, 16, 18, 20. insulated (°C): 80.0, 77.6, 75.4, 73.2, 71.1, 69.1, 67.2, 65.3, 63.6, 61.9, 60.2. not insulated (°C): 80.0, 73.2, 67.2, 61.9, 57.1, 52.9, 49.2, 45.9, 43.0, 40.4, 38.1. x axis: time (min), y axis: temperature (°C).
Forma Visuals · Chart your data · Examples
Cooling curve line chart
Two conditions measured over the same times, one line each, for the classic cooling experiment.
For students and scientists · Vega-Lite
Try it in the consoleOpen the Vega-Lite editor
The playground allows illustrative values: any number your request does not give, Forma writes, and the answer says generated. Over the API and MCP, that request is refused unless it sets allow_generated_data.
01 The chart
Drawn from the code that came back.
valid · chart@cb3749b2 · 1 credit · 2026-10-07
Sent with the API's default setting, under which a chart is drawn only from values the request gives.
02 The request
In plain words, with its values.
03 What came back
A Vega-Lite spec.
Indented for reading.
{
  "$schema": "https://vega.github.io/schema/vega-lite/v6.json",
  "name": "water_temp",
  "data": {
    "values": [
      {
        "time": 0,
        "beaker": "Insulated",
        "temp": 80
      },
      {
        "time": 0,
        "beaker": "Not Insulated",
        "temp": 80
      },
      {
        "time": 2,
        "beaker": "Insulated",
        "temp": 77.6
      },
      {
        "time": 2,
        "beaker": "Not Insulated",
        "temp": 73.2
      },
      {
        "time": 4,
        "beaker": "Insulated",
        "temp": 75.4
      },
      {
        "time": 4,
        "beaker": "Not Insulated",
        "temp": 67.2
      },
      {
        "time": 6,
        "beaker": "Insulated",
        "temp": 73.2
      },
      {
        "time": 6,
        "beaker": "Not Insulated",
        "temp": 61.9
      },
      {
        "time": 8,
        "beaker": "Insulated",
        "temp": 71.1
      },
      {
        "time": 8,
        "beaker": "Not Insulated",
        "temp": 57.1
      },
      {
        "time": 10,
        "beaker": "Insulated",
        "temp": 69.1
      },
      {
        "time": 10,
        "beaker": "Not Insulated",
        "temp": 52.9
      },
      {
        "time": 12,
        "beaker": "Insulated",
        "temp": 67.2
      },
      {
        "time": 12,
        "beaker": "Not Insulated",
        "temp": 49.2
      },
      {
        "time": 14,
        "beaker": "Insulated",
        "temp": 65.3
      },
      {
        "time": 14,
        "beaker": "Not Insulated",
        "temp": 45.9
      },
      {
        "time": 16,
        "beaker": "Insulated",
        "temp": 63.6
      },
      {
        "time": 16,
        "beaker": "Not Insulated",
        "temp": 43
      },
      {
        "time": 18,
        "beaker": "Insulated",
        "temp": 61.9
      },
      {
        "time": 18,
        "beaker": "Not Insulated",
        "temp": 40.4
      },
      {
        "time": 20,
        "beaker": "Insulated",
        "temp": 60.2
      },
      {
        "time": 20,
        "beaker": "Not Insulated",
        "temp": 38.1
      }
    ]
  },
  "title": "Water Temperature Over Time",
  "mark": "line",
  "encoding": {
    "x": {
      "field": "time",
      "type": "quantitative",
      "axis": {
        "title": "Time (min)"
      }
    },
    "y": {
      "field": "temp",
      "type": "quantitative",
      "axis": {
        "title": "Temperature (°C)"
      }
    },
    "color": {
      "field": "beaker",
      "type": "nominal",
      "sort": null
    }
  }
}
04 When to use it
Where this chart helps.
- Two or three conditions measured at the same times.
- One line per condition on one axis shows which changes faster.
- Mark the readings with points if you took few of them.