Histogram of 40 reaction times in milliseconds: 245, 269, 204, 249, 241, 227, 226, 257, 274, 242, 207, 234, 255, 203, 192, 222, 197, 242, 244, 275, 230, 242, 271, 210, 255, 278, 224, 276, 264, 183, 249, 248, 271, 272, 281, 235, 251, 240, 231, 284. x axis: reaction time (ms), y axis: count.
Forma Visuals · Chart your data · Examples
Histogram of measurements in gnuplot
Forty measurements, binned, for the results section of a lab report, as a gnuplot script you can run and edit.
For students and scientists · gnuplot
Try it in the consoleOpen the gnuplot editor
The playground allows illustrative values: any number your request does not give, Forma writes, and the answer says generated. Over the API and MCP, that request is refused unless it sets allow_generated_data.
01 The chart
Drawn from the code that came back.
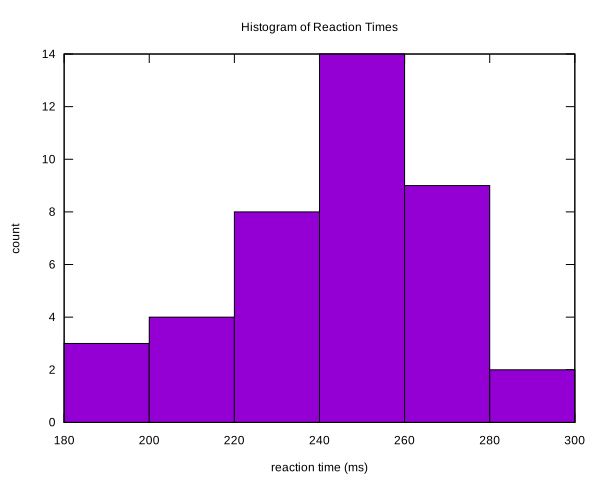
valid · chart@cb3749b2 · 1 credit · 2026-10-09
Sent with the API's default setting, under which a chart is drawn only from values the request gives.
02 The request
In plain words, with its values.
03 What came back
A gnuplot script.
# Generated from Zenith AST
# Zenith chart name: "reaction_histogram"
reset
set datafile columnheaders
set yrange [*<0:0<*]
set title "Histogram of Reaction Times"
set boxwidth 0.8 relative
set style fill solid 1.0 border -1
set xlabel "reaction time (ms)"
set ylabel "count"

$ZENITH_DATA << EOD
"reaction"
245
269
204
249
241
227
226
257
274
242
207
234
255
203
192
222
197
242
244
275
230
242
271
210
255
278
224
276
264
183
249
248
271
272
281
235
251
240
231
284
EOD

$ZENITH_BINS << EOD
"bin_start" "bin_end" "bin_value"
180 200 3
200 220 4
220 240 8
240 260 14
260 280 9
280 300 2
EOD

plot $ZENITH_BINS using (($1+$2)/2):3:($2-$1) with boxes notitle
04 When to use it
Where this chart helps.
- The spread of one measured quantity across many trials.
- Five to fifteen bars usually shows the shape; say the bin width in the caption.
- The counts are worked out from your measurements, so they are not compared with the request; the measurements are.