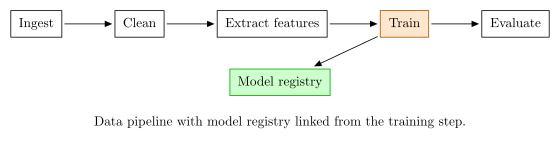
A data pipeline as boxes joined by arrows, left to right: Ingest, Clean, Extract features, Train, Evaluate. Under Train, a box Model registry with an arrow from Train down to it.
Forma Visuals · Draw a technical or research figure · Examples
Data pipeline diagram in TikZ
Stages as boxes, data flow as arrows, for a methods section or an architecture slide.
For researchers · TikZ
01 The figure
Drawn from the code that came back.
valid · vector-graphics@0bd7c5a4 · 1 credit · 2026-10-07
The check covers the properties the figure states, in the figure you receive. Measurements are not compared with the drawing: read the source.
02 The request
In plain words.
03 What came back
A tikzpicture.
\begin{tikzpicture}[x=1pt,y=1pt]
  \path[use as bounding box] (0,0) rectangle (421.49,104.25);
  \filldraw[draw=orange!65!black,line width=0.6pt,fill=orange!20] (286.25,76.25) rectangle (322.73,96.25);
  \node[text=black,anchor=center,font=\fontsize{10pt}{12pt}\selectfont] at (304.49,86.25) {\strut Train};
  \filldraw[draw=green!65!black,line width=0.6pt,fill=green!20] (173.02,32.25) rectangle (248.47,52.25);
  \node[text=black,anchor=center,font=\fontsize{10pt}{12pt}\selectfont] at (210.74,42.25) {\strut Model registry};
  \draw[draw=black,line width=0.6pt,fill=none] (8,76.25) rectangle (46.44,96.25);
  \node[text=black,anchor=center,font=\fontsize{10pt}{12pt}\selectfont] at (27.22,86.25) {\strut Ingest};
  \draw[draw=black,line width=0.6pt,fill=none] (86.44,76.25) rectangle (123.44,96.25);
  \node[text=black,anchor=center,font=\fontsize{10pt}{12pt}\selectfont] at (104.94,86.25) {\strut Clean};
  \draw[draw=black,line width=0.6pt,fill=none] (163.44,76.25) rectangle (246.25,96.25);
  \node[text=black,anchor=center,font=\fontsize{10pt}{12pt}\selectfont] at (204.84,86.25) {\strut Extract features};
  \draw[draw=black,line width=0.6pt,fill=none] (362.73,76.25) rectangle (413.49,96.25);
  \node[text=black,anchor=center,font=\fontsize{10pt}{12pt}\selectfont] at (388.11,86.25) {\strut Evaluate};
  \draw[draw=black,line width=0.6pt] (48.44,86.25) -- (81.02,86.25);
  \filldraw[draw=none,line width=0.4pt,fill=black] (84.44,86.25) -- (78.74,88.64) -- (78.74,83.86) -- cycle;
  \draw[draw=black,line width=0.6pt] (125.44,86.25) -- (158.02,86.25);
  \filldraw[draw=none,line width=0.4pt,fill=black] (161.44,86.25) -- (155.74,88.64) -- (155.74,83.86) -- cycle;
  \draw[draw=black,line width=0.6pt] (248.25,86.25) -- (280.83,86.25);
  \filldraw[draw=none,line width=0.4pt,fill=black] (284.25,86.25) -- (278.55,88.64) -- (278.55,83.86) -- cycle;
  \draw[draw=black,line width=0.6pt] (324.73,86.25) -- (357.31,86.25);
  \filldraw[draw=none,line width=0.4pt,fill=black] (360.73,86.25) -- (355.03,88.64) -- (355.03,83.86) -- cycle;
  \draw[draw=black,line width=0.6pt] (284.25,76.75) -- (239.41,55.7);
  \filldraw[draw=none,line width=0.4pt,fill=black] (236.31,54.25) -- (242.49,54.5) -- (240.45,58.84) -- cycle;
  \node[text=black,anchor=center,font=\fontsize{10pt}{12pt}\selectfont] at (261.98,57.63) {};
  \node[text=black,anchor=center,font=\fontsize{10pt}{12pt}\selectfont] at (210.74,12.25) {Data pipeline with model registry linked from the training step.};
\end{tikzpicture}
04 When to use it
Where this figure helps.
- A process with stages in order, and a branch or two.
- Keep the stage names short; long labels widen every box.
- Read the source: the check covers what the figure states.