Scatter plot of absorbance against concentration with a line of best fit. concentration (mM), absorbance: 0 0.01, 0.5 0.12, 1.0 0.23, 1.5 0.35, 2.0 0.46, 2.5 0.57, 3.0 0.70, 3.5 0.80, 4.0 0.93, 4.5 1.03, 5.0 1.16, 5.5 1.26. Draw the line of best fit (least squares) as a straight line from (0, 0.005) to (5.5, 1.265). x axis: concentration (mM), y axis: absorbance.
Forma Visuals · Chart your data · Examples
Scatter plot with a line of best fit in gnuplot
Twelve measurements and a straight line for a lab report, as a gnuplot script you can run and edit.
For students and scientists · gnuplot
Try it in the consoleOpen the gnuplot editor
The playground allows illustrative values: any number your request does not give, Forma writes, and the answer says generated. Over the API and MCP, that request is refused unless it sets allow_generated_data.
01 The chart
Drawn from the code that came back.
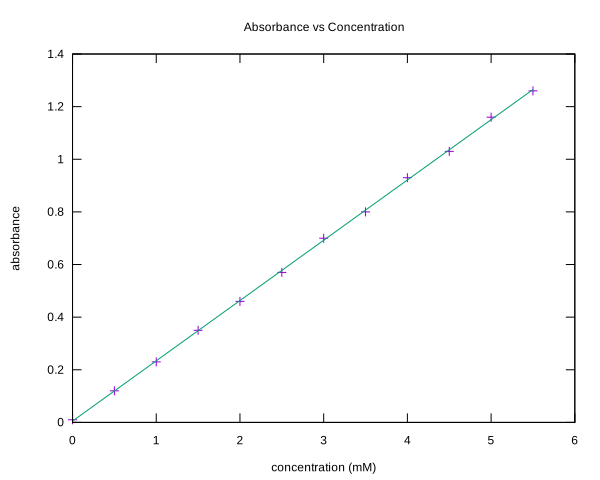
valid · chart@cb3749b2 · 1 credit · 2026-10-09
Sent with the API's default setting, under which a chart is drawn only from values the request gives.
02 The request
In plain words, with its values.
03 What came back
A gnuplot script.
# Generated from Zenith AST
# Zenith chart name: "absorbance"
reset
set datafile columnheaders
set title "Absorbance vs Concentration"
set xlabel "concentration (mM)"
set ylabel "absorbance"

$ZENITH_DATA << EOD
"concentration" "absorbance"
0 0.01
0.5 0.12
1.0 0.23000000000000001
1.5 0.34999999999999998
2.0 0.46000000000000002
2.5 0.56999999999999995
3.0 0.69999999999999996
3.5 0.80000000000000004
4.0 0.93000000000000005
4.5 1.03
5.0 1.1599999999999999
5.5 1.26
EOD

$ZENITH_LAYER_2 << EOD
"concentration" "absorbance"
0 0.0050000000000000001
5.5 1.2649999999999999
EOD

plot $ZENITH_DATA using "concentration":"absorbance" with points notitle, \
     $ZENITH_LAYER_2 using "concentration":"absorbance" with lines notitle
04 When to use it
Where this chart helps.
- Two measured quantities, where the reader looks for a straight-line relationship.
- The line runs between the two ends the request states, so work out the least-squares fit first and give its ends.
- Label both axes with units, as the request does.