Horizontal bar chart of error rate by service over the last 24 hours, sorted highest first. service, error rate: api 0.42%, auth 0.08%, billing 1.31%, search 0.27%, worker 0.65%. x axis: error rate (%).
Forma Visuals · Chart your data · Examples
Error rate by service in ECharts
An ECharts option you can pass straight to setOption, for a status page or an internal dashboard, drawn from the rates the request gives.
For developers · ECharts
Try it in the consoleOpen the ECharts editor
The playground allows illustrative values: any number your request does not give, Forma writes, and the answer says generated. Over the API and MCP, that request is refused unless it sets allow_generated_data.
01 The chart
Drawn from the code that came back.
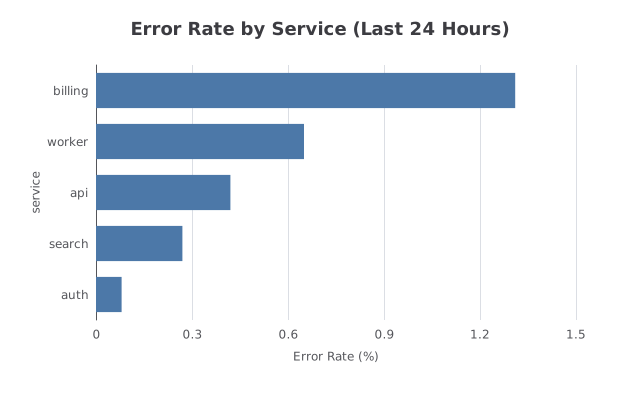
valid · chart@cb3749b2 · 1 credit · 2026-10-09
Sent with the API's default setting, under which a chart is drawn only from values the request gives.
02 The request
In plain words, with its values.
03 What came back
An ECharts option.
Indented for reading.
{
  "title": {
    "text": "Error Rate by Service (Last 24 Hours)",
    "left": "center"
  },
  "tooltip": {
    "trigger": "axis"
  },
  "xAxis": {
    "type": "value",
    "name": "Error Rate (%)",
    "nameLocation": "middle",
    "nameGap": 30
  },
  "yAxis": {
    "type": "category",
    "data": [
      "billing",
      "worker",
      "api",
      "search",
      "auth"
    ],
    "name": "service",
    "nameLocation": "middle",
    "nameGap": 50,
    "inverse": true
  },
  "series": [
    {
      "type": "bar",
      "itemStyle": {
        "color": "#4c78a8"
      },
      "data": [
        1.31,
        0.65,
        0.42,
        0.27,
        0.08
      ]
    }
  ]
}
04 When to use it
Where this chart helps.
- Ranking services, endpoints or queues by one measure.
- Horizontal bars keep long service names readable.
- From code or an agent, send the same request to the API or over MCP and render the option you get back.