Stacked bar chart of one account's API calls per day by endpoint for one week, from this JSON: [{"day":"Mon","endpoint":"/search","calls":1180},{"day":"Mon","endpoint":"/orders","calls":3420},{"day":"Mon","endpoint":"/users","calls":2150},{"day":"Tue","endpoint":"/search","calls":1240},{"day":"Tue","endpoint":"/orders","calls":3510},{"day":"Tue","endpoint":"/users","calls":2230},{"day":"Wed","endpoint":"/search","calls":1265},{"day":"Wed","endpoint":"/orders","calls":3580},{"day":"Wed","endpoint":"/users","calls":2275},{"day":"Thu","endpoint":"/search","calls":1290},{"day":"Thu","endpoint":"/orders","calls":3615},{"day":"Thu","endpoint":"/users","calls":2310},{"day":"Fri","endpoint":"/search","calls":1210},{"day":"Fri","endpoint":"/orders","calls":3470},{"day":"Fri","endpoint":"/users","calls":2190},{"day":"Sat","endpoint":"/search","calls":640},{"day":"Sat","endpoint":"/orders","calls":1820},{"day":"Sat","endpoint":"/users","calls":980},{"day":"Sun","endpoint":"/search","calls":590},{"day":"Sun","endpoint":"/orders","calls":1705},{"day":"Sun","endpoint":"/users","calls":915}]. x axis: day, y axis: API calls.
Forma Visuals · Chart your data · Examples
API calls per day by endpoint in Chart.js
One customer's usage as your API returns it, sent as JSON, back as a Chart.js config to show that customer on their usage page.
For developers · Chart.js
Try it in the consoleOpen the Chart.js editor
The playground allows illustrative values: any number your request does not give, Forma writes, and the answer says generated. Over the API and MCP, that request is refused unless it sets allow_generated_data.
01 The chart
Drawn from the code that came back.
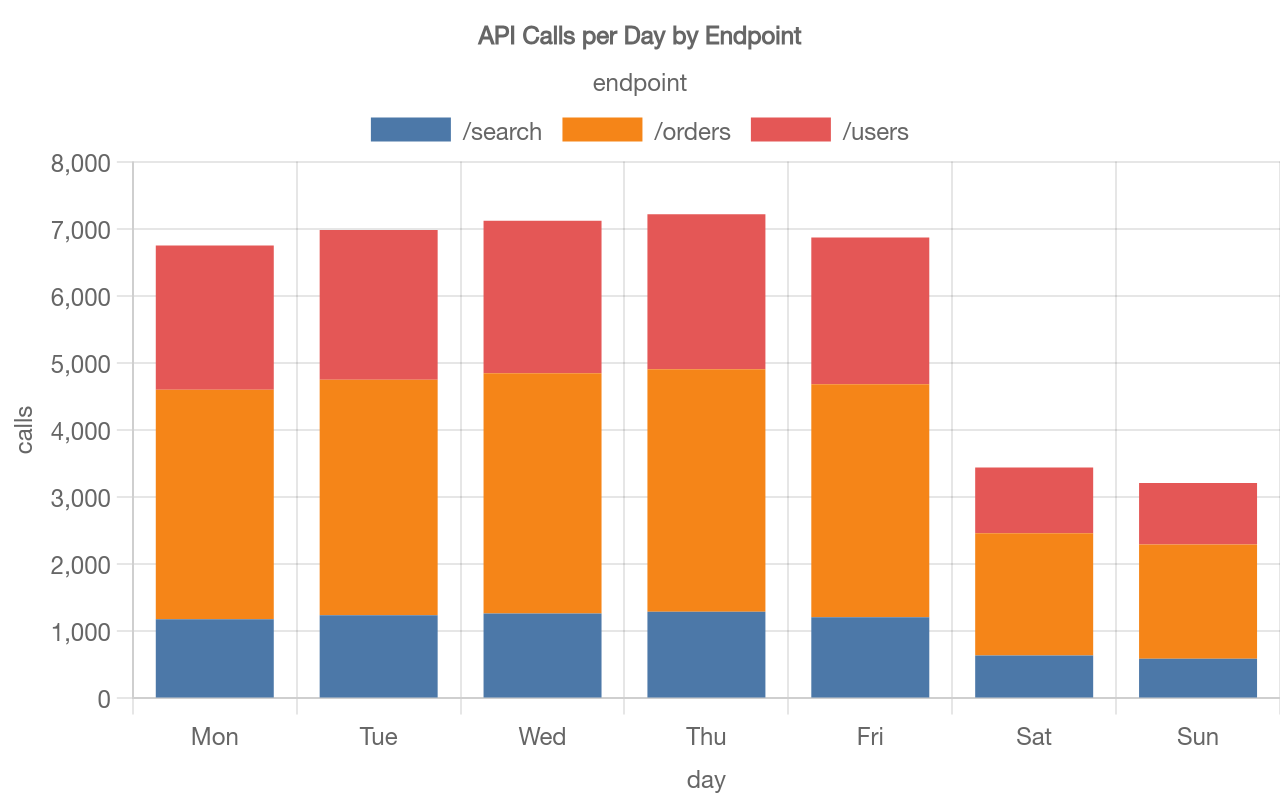
valid · chart@cb3749b2 · 1 credit · 2026-10-07
Sent with the API's default setting, under which a chart is drawn only from values the request gives.
02 The request
In plain words, with its values.
03 What came back
A Chart.js config.
Indented for reading.
{
  "type": "bar",
  "data": {
    "labels": [
      "Mon",
      "Tue",
      "Wed",
      "Thu",
      "Fri",
      "Sat",
      "Sun"
    ],
    "datasets": [
      {
        "type": "bar",
        "label": "/search",
        "data": [
          1180,
          1240,
          1265,
          1290,
          1210,
          640,
          590
        ],
        "backgroundColor": "#4c78a8",
        "borderColor": "#4c78a8"
      },
      {
        "type": "bar",
        "label": "/orders",
        "data": [
          3420,
          3510,
          3580,
          3615,
          3470,
          1820,
          1705
        ],
        "backgroundColor": "#f58518",
        "borderColor": "#f58518"
      },
      {
        "type": "bar",
        "label": "/users",
        "data": [
          2150,
          2230,
          2275,
          2310,
          2190,
          980,
          915
        ],
        "backgroundColor": "#e45756",
        "borderColor": "#e45756"
      }
    ]
  },
  "options": {
    "plugins": {
      "title": {
        "display": true,
        "text": "API Calls per Day by Endpoint"
      },
      "legend": {
        "display": true,
        "title": {
          "display": true,
          "text": "endpoint"
        }
      }
    },
    "scales": {
      "x": {
        "type": "category",
        "title": {
          "display": true,
          "text": "day"
        },
        "stacked": true
      },
      "y": {
        "type": "linear",
        "title": {
          "display": true,
          "text": "calls"
        },
        "stacked": true,
        "beginAtZero": true
      }
    }
  }
}
04 When to use it
Where this chart helps.
- A customer's usage split by endpoint, feature or region, where both the day's total and its parts matter.
- Stacked bars show each day's total; to follow one endpoint across the week, one line per endpoint reads more easily.
- The config is plain JSON, ready for new Chart(ctx, config).