Histogram of 40 API response times in milliseconds: 87, 91, 155, 182, 169, 99, 116, 114, 88, 193, 154, 208, 94, 132, 94, 144, 163, 112, 171, 269, 80, 122, 165, 200, 143, 90, 107, 196, 121, 203, 119, 161, 104, 217, 119, 117, 111, 181, 72, 115. x axis: response time (ms), y axis: requests.
Forma Visuals · Chart your data · Examples
Response time histogram in Chart.js
The shape of your latency, not just its average: how many requests were fast, and how long the slow tail runs.
For developers · Chart.js
Try it in the consoleOpen the Chart.js editor
The playground allows illustrative values: any number your request does not give, Forma writes, and the answer says generated. Over the API and MCP, that request is refused unless it sets allow_generated_data.
01 The chart
Drawn from the code that came back.
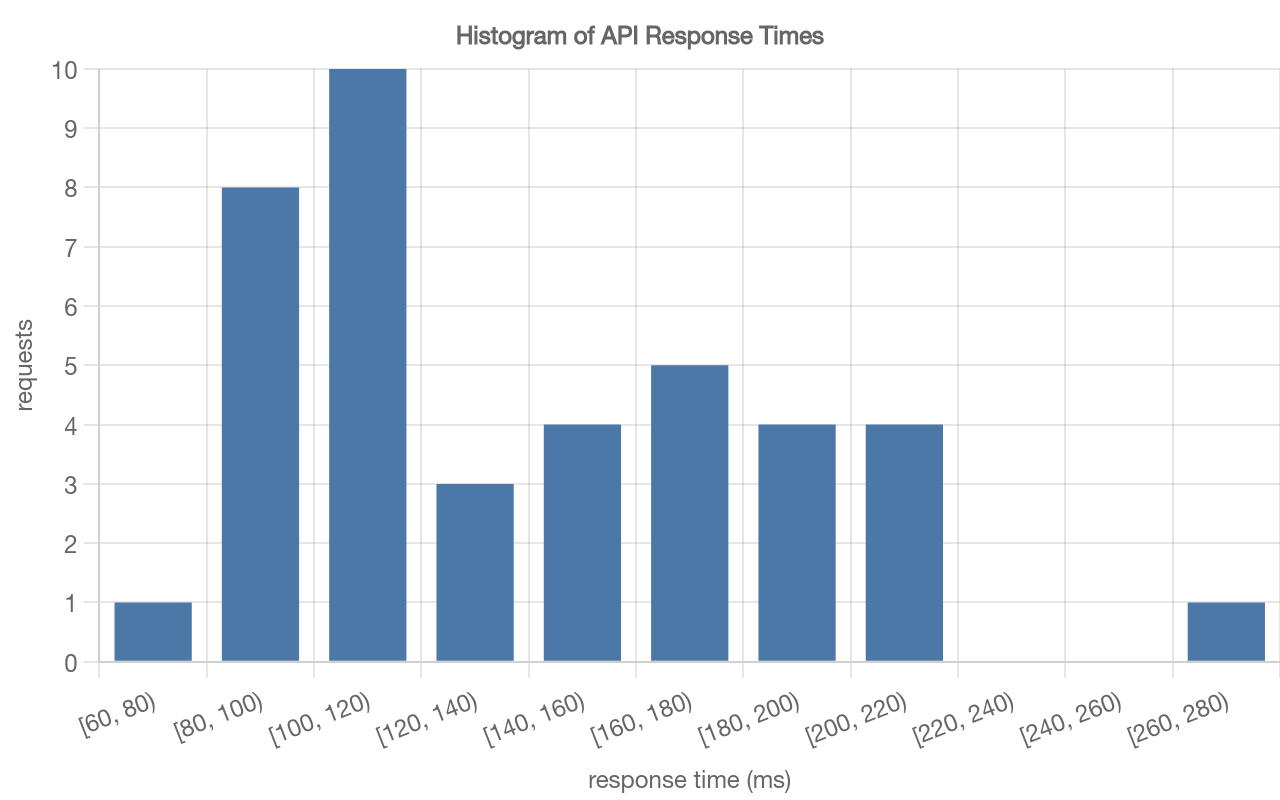
valid · chart@cb3749b2 · 1 credit · 2026-10-09
Sent with the API's default setting, under which a chart is drawn only from values the request gives.
02 The request
In plain words, with its values.
03 What came back
A Chart.js config.
Indented for reading.
{
  "type": "bar",
  "data": {
    "labels": [
      "[60, 80)",
      "[80, 100)",
      "[100, 120)",
      "[120, 140)",
      "[140, 160)",
      "[160, 180)",
      "[180, 200)",
      "[200, 220)",
      "[220, 240)",
      "[240, 260)",
      "[260, 280)"
    ],
    "datasets": [
      {
        "type": "bar",
        "data": [
          1,
          8,
          10,
          3,
          4,
          5,
          4,
          4,
          null,
          null,
          1
        ],
        "backgroundColor": "#4c78a8",
        "borderColor": "#4c78a8"
      }
    ]
  },
  "options": {
    "plugins": {
      "title": {
        "display": true,
        "text": "Histogram of API Response Times"
      },
      "legend": {
        "display": false
      }
    },
    "scales": {
      "x": {
        "type": "category",
        "title": {
          "display": true,
          "text": "response time (ms)"
        }
      },
      "y": {
        "type": "linear",
        "title": {
          "display": true,
          "text": "requests"
        },
        "beginAtZero": true
      }
    }
  }
}
04 When to use it
Where this chart helps.
- A distribution of one measure, such as response times or payload sizes.
- The number of bins changes the picture: try two before you settle on one, and look at the axis.
- The counts per bin are computed from your timings, so they are not compared with the request; the timings are.