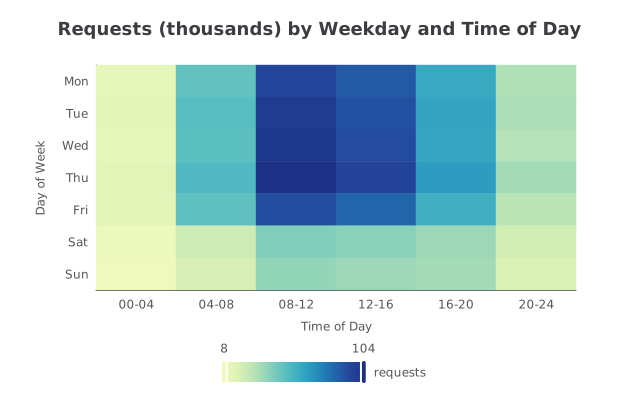
Heatmap of requests in thousands by weekday and time of day. day, then requests for 00-04, 04-08, 08-12, 12-16, 16-20 and 20-24: Mon 12 48 95 88 61 30, Tue 13 51 99 91 63 31, Wed 12 50 101 93 62 29, Thu 14 53 104 96 66 33, Fri 13 49 92 84 58 28, Sat 9 22 41 39 35 21, Sun 8 19 37 35 33 18. x axis: time of day, in the order given; y axis: day, Monday at the top.
Forma Visuals · Chart your data · Examples
Requests by weekday and time of day: an ECharts heatmap
When your traffic happens, at a glance: the busy weekday middays and the quiet weekend nights, for capacity planning or a status page.
For developers · ECharts
Try it in the consoleOpen the ECharts editor
The playground allows illustrative values: any number your request does not give, Forma writes, and the answer says generated. Over the API and MCP, that request is refused unless it sets allow_generated_data.
01 The chart
Drawn from the code that came back.
valid · chart@cb3749b2 · 1 credit · 2026-10-09
Sent with the API's default setting, under which a chart is drawn only from values the request gives.
02 The request
In plain words, with its values.
03 What came back
An ECharts option.
Indented for reading.
{
  "title": {
    "text": "Requests (thousands) by Weekday and Time of Day",
    "left": "center"
  },
  "tooltip": {
    "trigger": "item"
  },
  "xAxis": {
    "type": "category",
    "data": [
      "00-04",
      "04-08",
      "08-12",
      "12-16",
      "16-20",
      "20-24"
    ],
    "name": "Time of Day",
    "nameLocation": "middle",
    "nameGap": 30
  },
  "yAxis": {
    "type": "category",
    "data": [
      "Mon",
      "Tue",
      "Wed",
      "Thu",
      "Fri",
      "Sat",
      "Sun"
    ],
    "name": "Day of Week",
    "nameLocation": "middle",
    "nameGap": 50,
    "inverse": true
  },
  "series": [
    {
      "type": "heatmap",
      "data": [
        [
          "00-04",
          "Mon",
          12
        ],
        [
          "00-04",
          "Tue",
          13
        ],
        [
          "00-04",
          "Wed",
          12
        ],
        [
          "00-04",
          "Thu",
          14
        ],
        [
          "00-04",
          "Fri",
          13
        ],
        [
          "00-04",
          "Sat",
          9
        ],
        [
          "00-04",
          "Sun",
          8
        ],
        [
          "04-08",
          "Mon",
          48
        ],
        [
          "04-08",
          "Tue",
          51
        ],
        [
          "04-08",
          "Wed",
          50
        ],
        [
          "04-08",
          "Thu",
          53
        ],
        [
          "04-08",
          "Fri",
          49
        ],
        [
          "04-08",
          "Sat",
          22
        ],
        [
          "04-08",
          "Sun",
          19
        ],
        [
          "08-12",
          "Mon",
          95
        ],
        [
          "08-12",
          "Tue",
          99
        ],
        [
          "08-12",
          "Wed",
          101
        ],
        [
          "08-12",
          "Thu",
          104
        ],
        [
          "08-12",
          "Fri",
          92
        ],
        [
          "08-12",
          "Sat",
          41
        ],
        [
          "08-12",
          "Sun",
          37
        ],
        [
          "12-16",
          "Mon",
          88
        ],
        [
          "12-16",
          "Tue",
          91
        ],
        [
          "12-16",
          "Wed",
          93
        ],
        [
          "12-16",
          "Thu",
          96
        ],
        [
          "12-16",
          "Fri",
          84
        ],
        [
          "12-16",
          "Sat",
          39
        ],
        [
          "12-16",
          "Sun",
          35
        ],
        [
          "16-20",
          "Mon",
          61
        ],
        [
          "16-20",
          "Tue",
          63
        ],
        [
          "16-20",
          "Wed",
          62
        ],
        [
          "16-20",
          "Thu",
          66
        ],
        [
          "16-20",
          "Fri",
          58
        ],
        [
          "16-20",
          "Sat",
          35
        ],
        [
          "16-20",
          "Sun",
          33
        ],
        [
          "20-24",
          "Mon",
          30
        ],
        [
          "20-24",
          "Tue",
          31
        ],
        [
          "20-24",
          "Wed",
          29
        ],
        [
          "20-24",
          "Thu",
          33
        ],
        [
          "20-24",
          "Fri",
          28
        ],
        [
          "20-24",
          "Sat",
          21
        ],
        [
          "20-24",
          "Sun",
          18
        ]
      ]
    }
  ],
  "grid": {
    "bottom": 110
  },
  "visualMap": {
    "type": "continuous",
    "min": 8,
    "max": 104,
    "inRange": {
      "color": [
        "#eff9bd",
        "#dbf1b4",
        "#bde5b5",
        "#94d5b9",
        "#69c5be",
        "#45b4c2",
        "#2c9ec0",
        "#2182b8",
        "#2163aa",
        "#23479c",
        "#1c3185"
      ]
    },
    "calculable": true,
    "orient": "horizontal",
    "left": "center",
    "bottom": 0,
    "text": [
      "requests"
    ]
  }
}
04 When to use it
Where this chart helps.
- A count over two time dimensions, such as weekday by hour, where the pattern matters more than any one value.
- A colour scale shows the shape of the week; read exact values from the tooltip or a table.
- The option is plain JSON, ready for setOption.