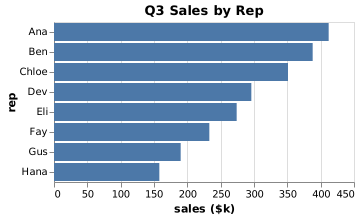
Horizontal bar chart of Q3 sales by sales rep, sorted highest first, in thousands of dollars. rep, sales: Ana 412, Ben 388, Chloe 351, Dev 296, Eli 274, Fay 233, Gus 190, Hana 158. x axis: sales ($k).
Forma Visuals · Chart your data · Examples
Sales by rep ranked bar chart
A league table as a chart: each rep's quarter, highest first, with names that stay readable on the side.
For analysts · Vega-Lite
Try it in the consoleOpen the Vega-Lite editor
The playground allows illustrative values: any number your request does not give, Forma writes, and the answer says generated. Over the API and MCP, that request is refused unless it sets allow_generated_data.
01 The chart
Drawn from the code that came back.
valid · chart@cb3749b2 · 1 credit · 2026-10-09
Sent with the API's default setting, under which a chart is drawn only from values the request gives.
02 The request
In plain words, with its values.
03 What came back
A Vega-Lite spec.
Indented for reading.
{
  "$schema": "https://vega.github.io/schema/vega-lite/v6.json",
  "name": "q3_sales",
  "data": {
    "values": [
      {
        "rep": "Ana",
        "sales": 412
      },
      {
        "rep": "Ben",
        "sales": 388
      },
      {
        "rep": "Chloe",
        "sales": 351
      },
      {
        "rep": "Dev",
        "sales": 296
      },
      {
        "rep": "Eli",
        "sales": 274
      },
      {
        "rep": "Fay",
        "sales": 233
      },
      {
        "rep": "Gus",
        "sales": 190
      },
      {
        "rep": "Hana",
        "sales": 158
      }
    ]
  },
  "title": "Q3 Sales by Rep",
  "mark": {
    "type": "bar",
    "orient": "horizontal"
  },
  "encoding": {
    "y": {
      "field": "rep",
      "type": "nominal",
      "sort": null
    },
    "x": {
      "field": "sales",
      "type": "quantitative",
      "axis": {
        "title": "sales ($k)"
      }
    }
  }
}
04 When to use it
Where this chart helps.
- Ranking people, products or accounts by one figure.
- Horizontal bars keep long names readable; sorting puts the question, who is top, at the top.
- For more than about fifteen rows, show the top ten and say so in the title.